Algorithm
The prediction server for predicting the protein as allergenic and non-allergenic has been designed in a very user-friendly manner. This page explains the compatibility of webserver on different operating systems, details of all the algorithms and methods used to develop models for prediction. help page
Browser compatibility:
Computation Time: Total computation time taken by AlgPred 2.0 for each protein in seconds (average)
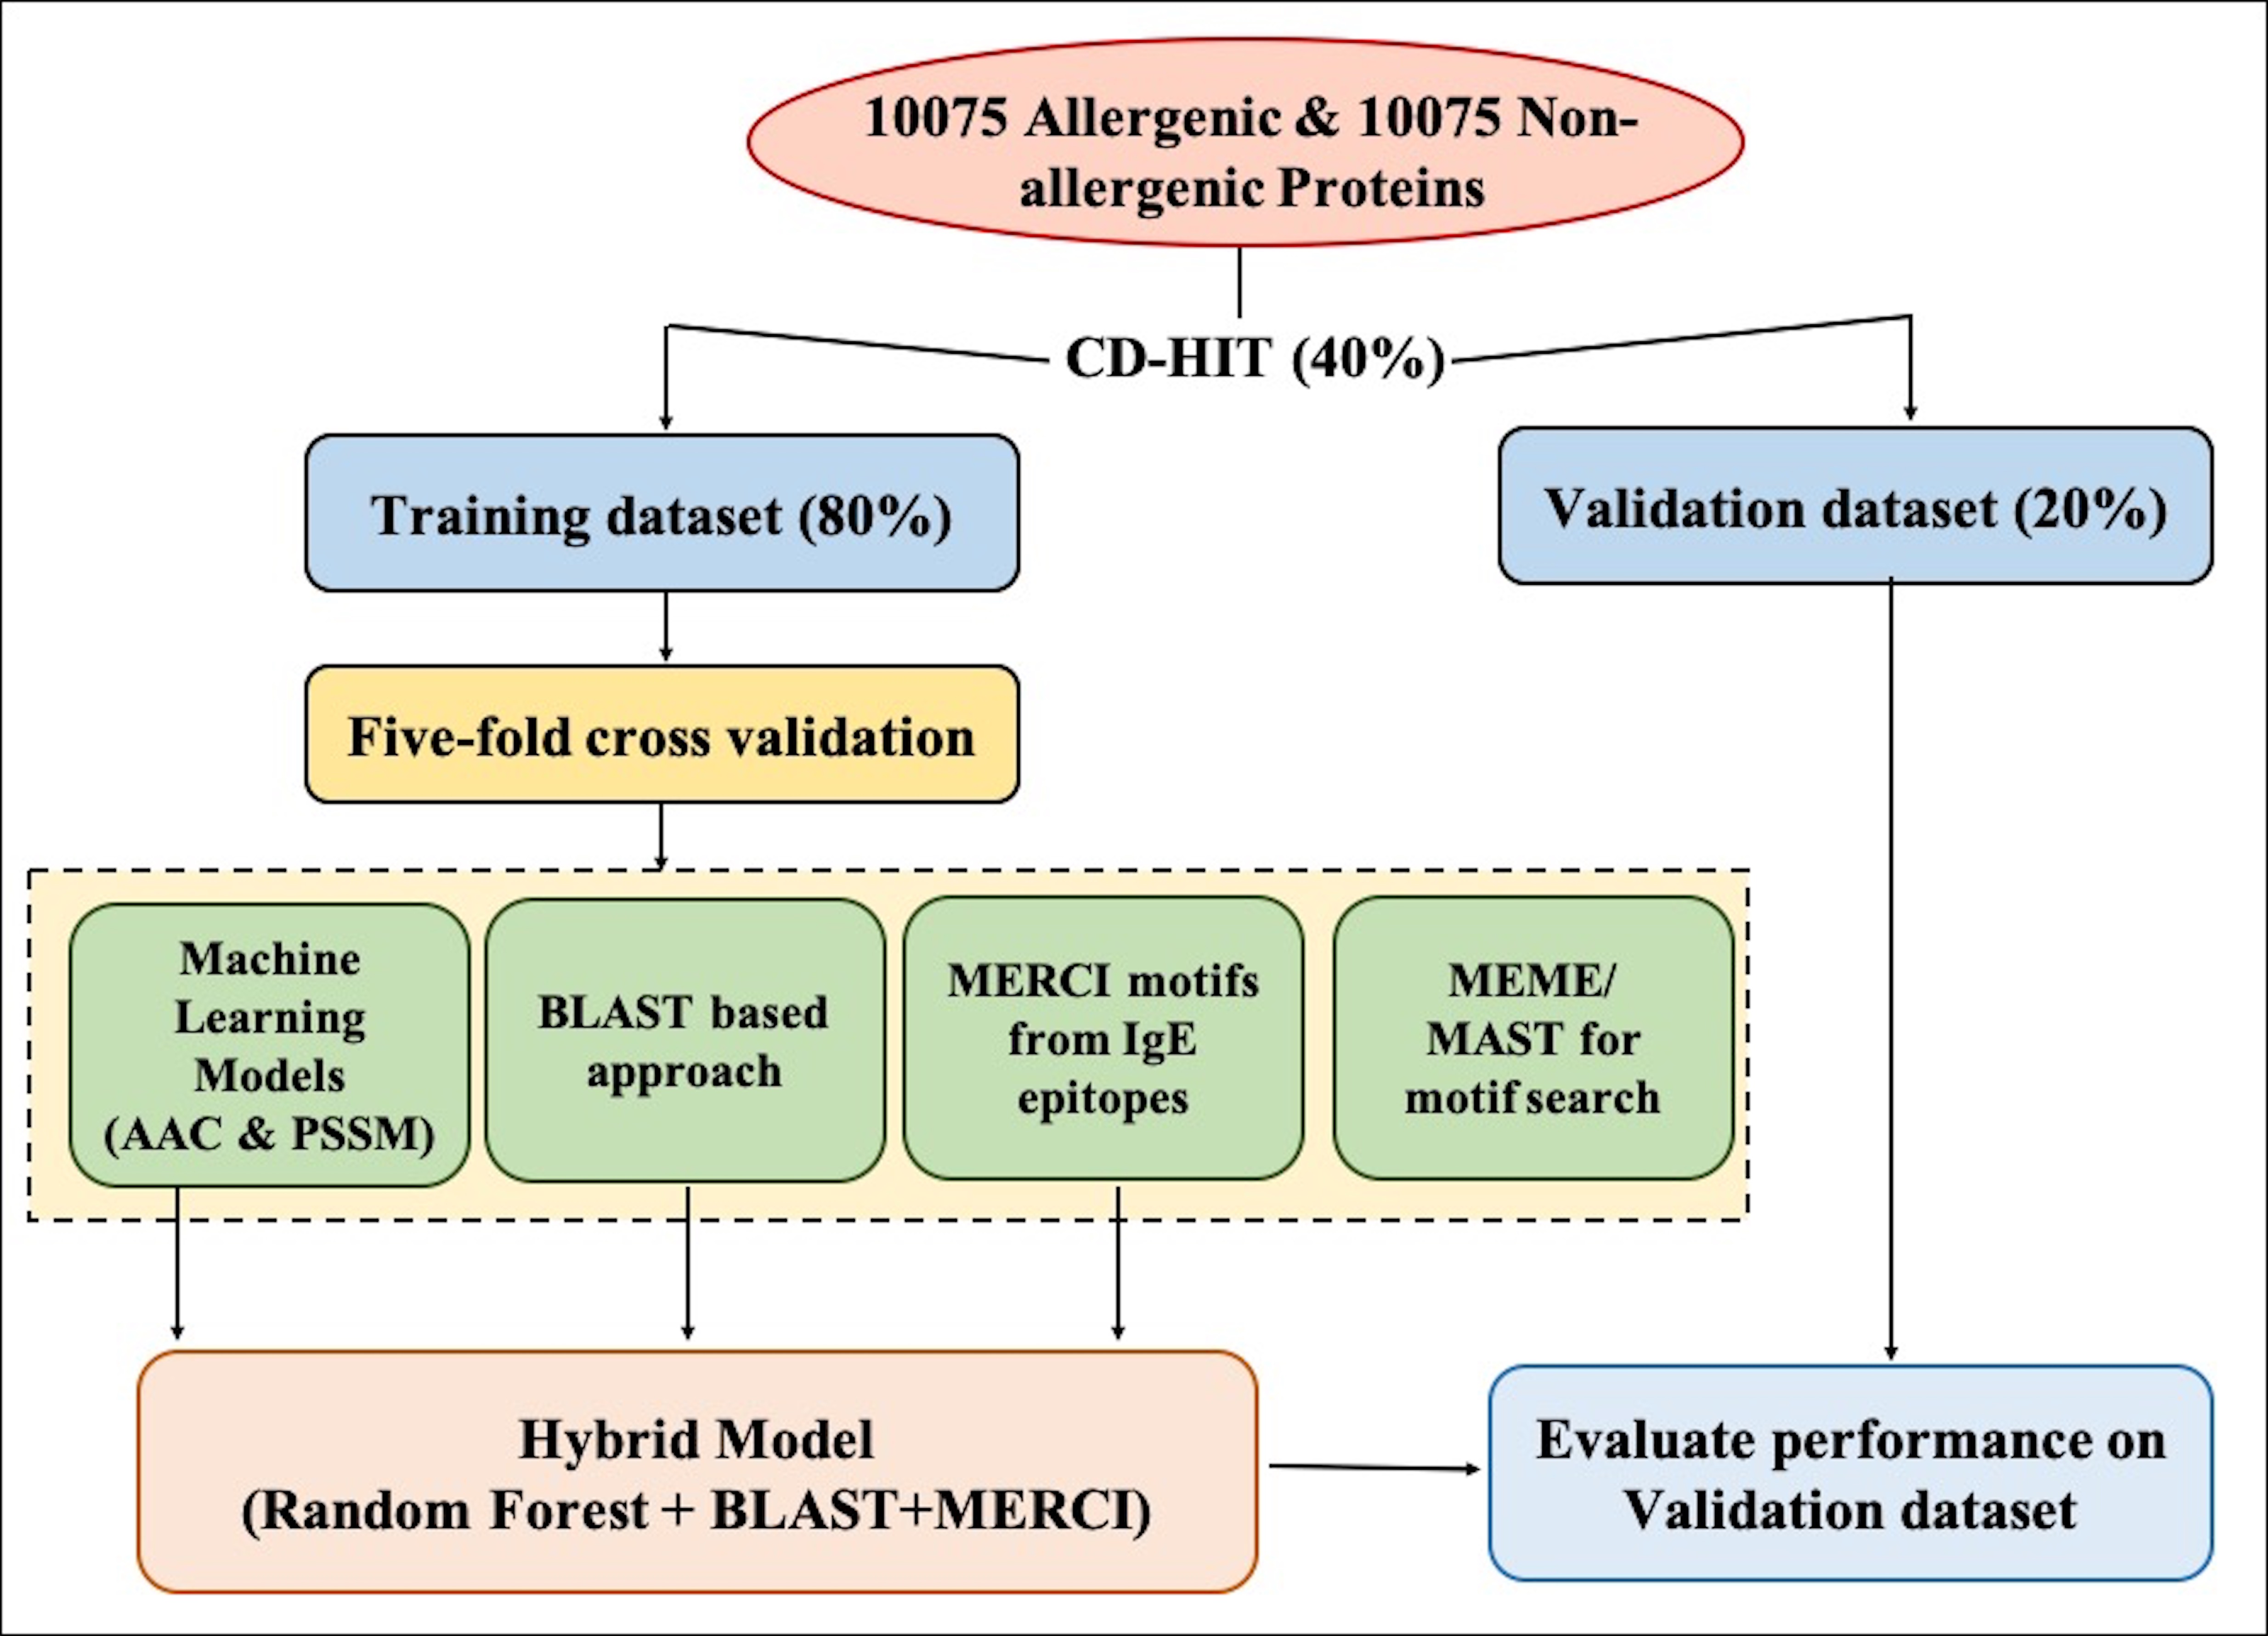
Dataset collection and partitioning:
Firstly, we have collected the positive (allergen) and negative (non-allergen) data from five different sources, namely, COMPARE, Allergen Online, AlgPred, AllerTop and Swiss-Prot. The number of allergens and non-allergens used in the study is 10,075. To create the dataset, we have used CD-HIT at 40% sequence identity on both positive and negative datasets respectively and obtained the clusters with similar sequences. After this, all the clusters obtained were divided into training and validation dataset in the ratio of 80:20. The clusters in 80% training data were further divided into five sets in such a way that all proteins of a cluster were kept in one set, and sequences in one set do not have similarity with sequences of other sets. This process aims to create non-redundant dataset without reducing the total number of proteins used in the study. This dataset is used for developing models for predicting allergenic and non-allergenic proteins.
Machine Learning-based Model:
In the present study, different classifiers were used from Scikit learn to develop the model. The software is freely available at https://scikit-learn.org/stable/
Random Forest (RF) based Model: The model built using RF classifier is the best performing model among others. It is a robust package which fits a many decision tree classifiers on multiple samples of the dataset and uses the concept of averaging to improve accuracy and prevents over-fitting. It is user-friendly where we can tweak the parameters like the number of trees in the forest (n_estimators), the minimum number of sample required to split the internal node (min_samples_split), number of features (max_features) etc.
Support vector machine (SVM) based Model: Another model was developed using SVC (Support Vector Classification) method of SVM (SVC classifier). Here also, we can tweak the parameters and kernel function like Linear, Polynomial, RBF and Sigmoid.
K-Nearest Neighbor (kNN) based Model:
KNeighborsClassifier was also used to develop the model to predict allergenic and non-allergenic protein. This classifier uses the k-nearest neighbors to vote for each query point, where k is an integer value defined by the user. We can adjust the parameters like the number of neighbors (n_neighbors), weight function used for prediction (weights), the algorithm used to compute the nearest neighbors (algorithm) etc.
Multi-layer Perceptron (MLP) based Model: MLPClassifier uses sklearn.neural_network module which builds the model based on neural networks. We can tweak the parameters such as the number of hidden layers (hidden_layer_sizes), activation function (activation), solver for weight optimization (solver) to prevent overfitting.
Protein Features Extraction
(a)Composition based features:
(b)Evolutionary information-based features
Five fold cross-validation: The performance of all methods developed in this study is evaluated using five-fold cross-validation. 80% of the whole dataset has been divided into five sets. The training sets were formed by combining four sets and remaining one set as testing set. This method is repeated five times to make five training and five testing sets. The overall performance of a method is average performance over five sets.
Performance Measure: The performance of any classification is estimated using two types of measures known as threshold-dependent and threshold-independent measures. In this study, we used both types of measure to evaluate the performance of models.
I) Threshold-dependent Measures:
Four parameters were used to measure the performance of prediction methods mentioned below: b) Specificity (Spec): It is defined as the percentage of correctly predicted non-epitopes.
c) Accuracy (Acc): It is defined as the percentage of the total number of correct predictions out of the total number of instances.
d) Matthews correlation coefficient (MCC): It is the correlation between observed and predicted values.
where TP, TN, FP and FN refer to true positives and true negatives, false positives and false negatives respectively.
II) Threshold-independent Measures: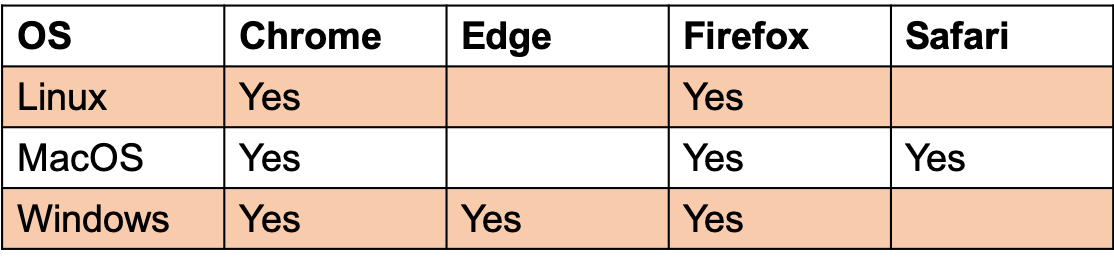
Amino Acid Composition (AAC): It is a 20 length vector where each element represents the fraction of each amino acid present in the protein sequence.
PSSM profiles: Position-specific scoring matrix (PSSM) was generated using PSI-BLAST search against non-redundant (nr) database of protein sequences at NCBI. The PSSM profiles represent the probability of occurrence of each type of amino acid residues at each position. The vector length of PSSM composition profiles is 400 (20x20).
a) Sensitivity (Sens): It is defined as the percentage of allergens that are correctly predicted as allergens.


Area Under Receiver Operating Characteristics (AUROC): It is the plot between Sens (True Positive Rate) and 1-Spec (False Positive Rate), where Sens is on the y-axis, and 1-Spec is on the x-axis. It is the measure of separability, and it signifies that how well the model is capable of distinguishing between the classes.