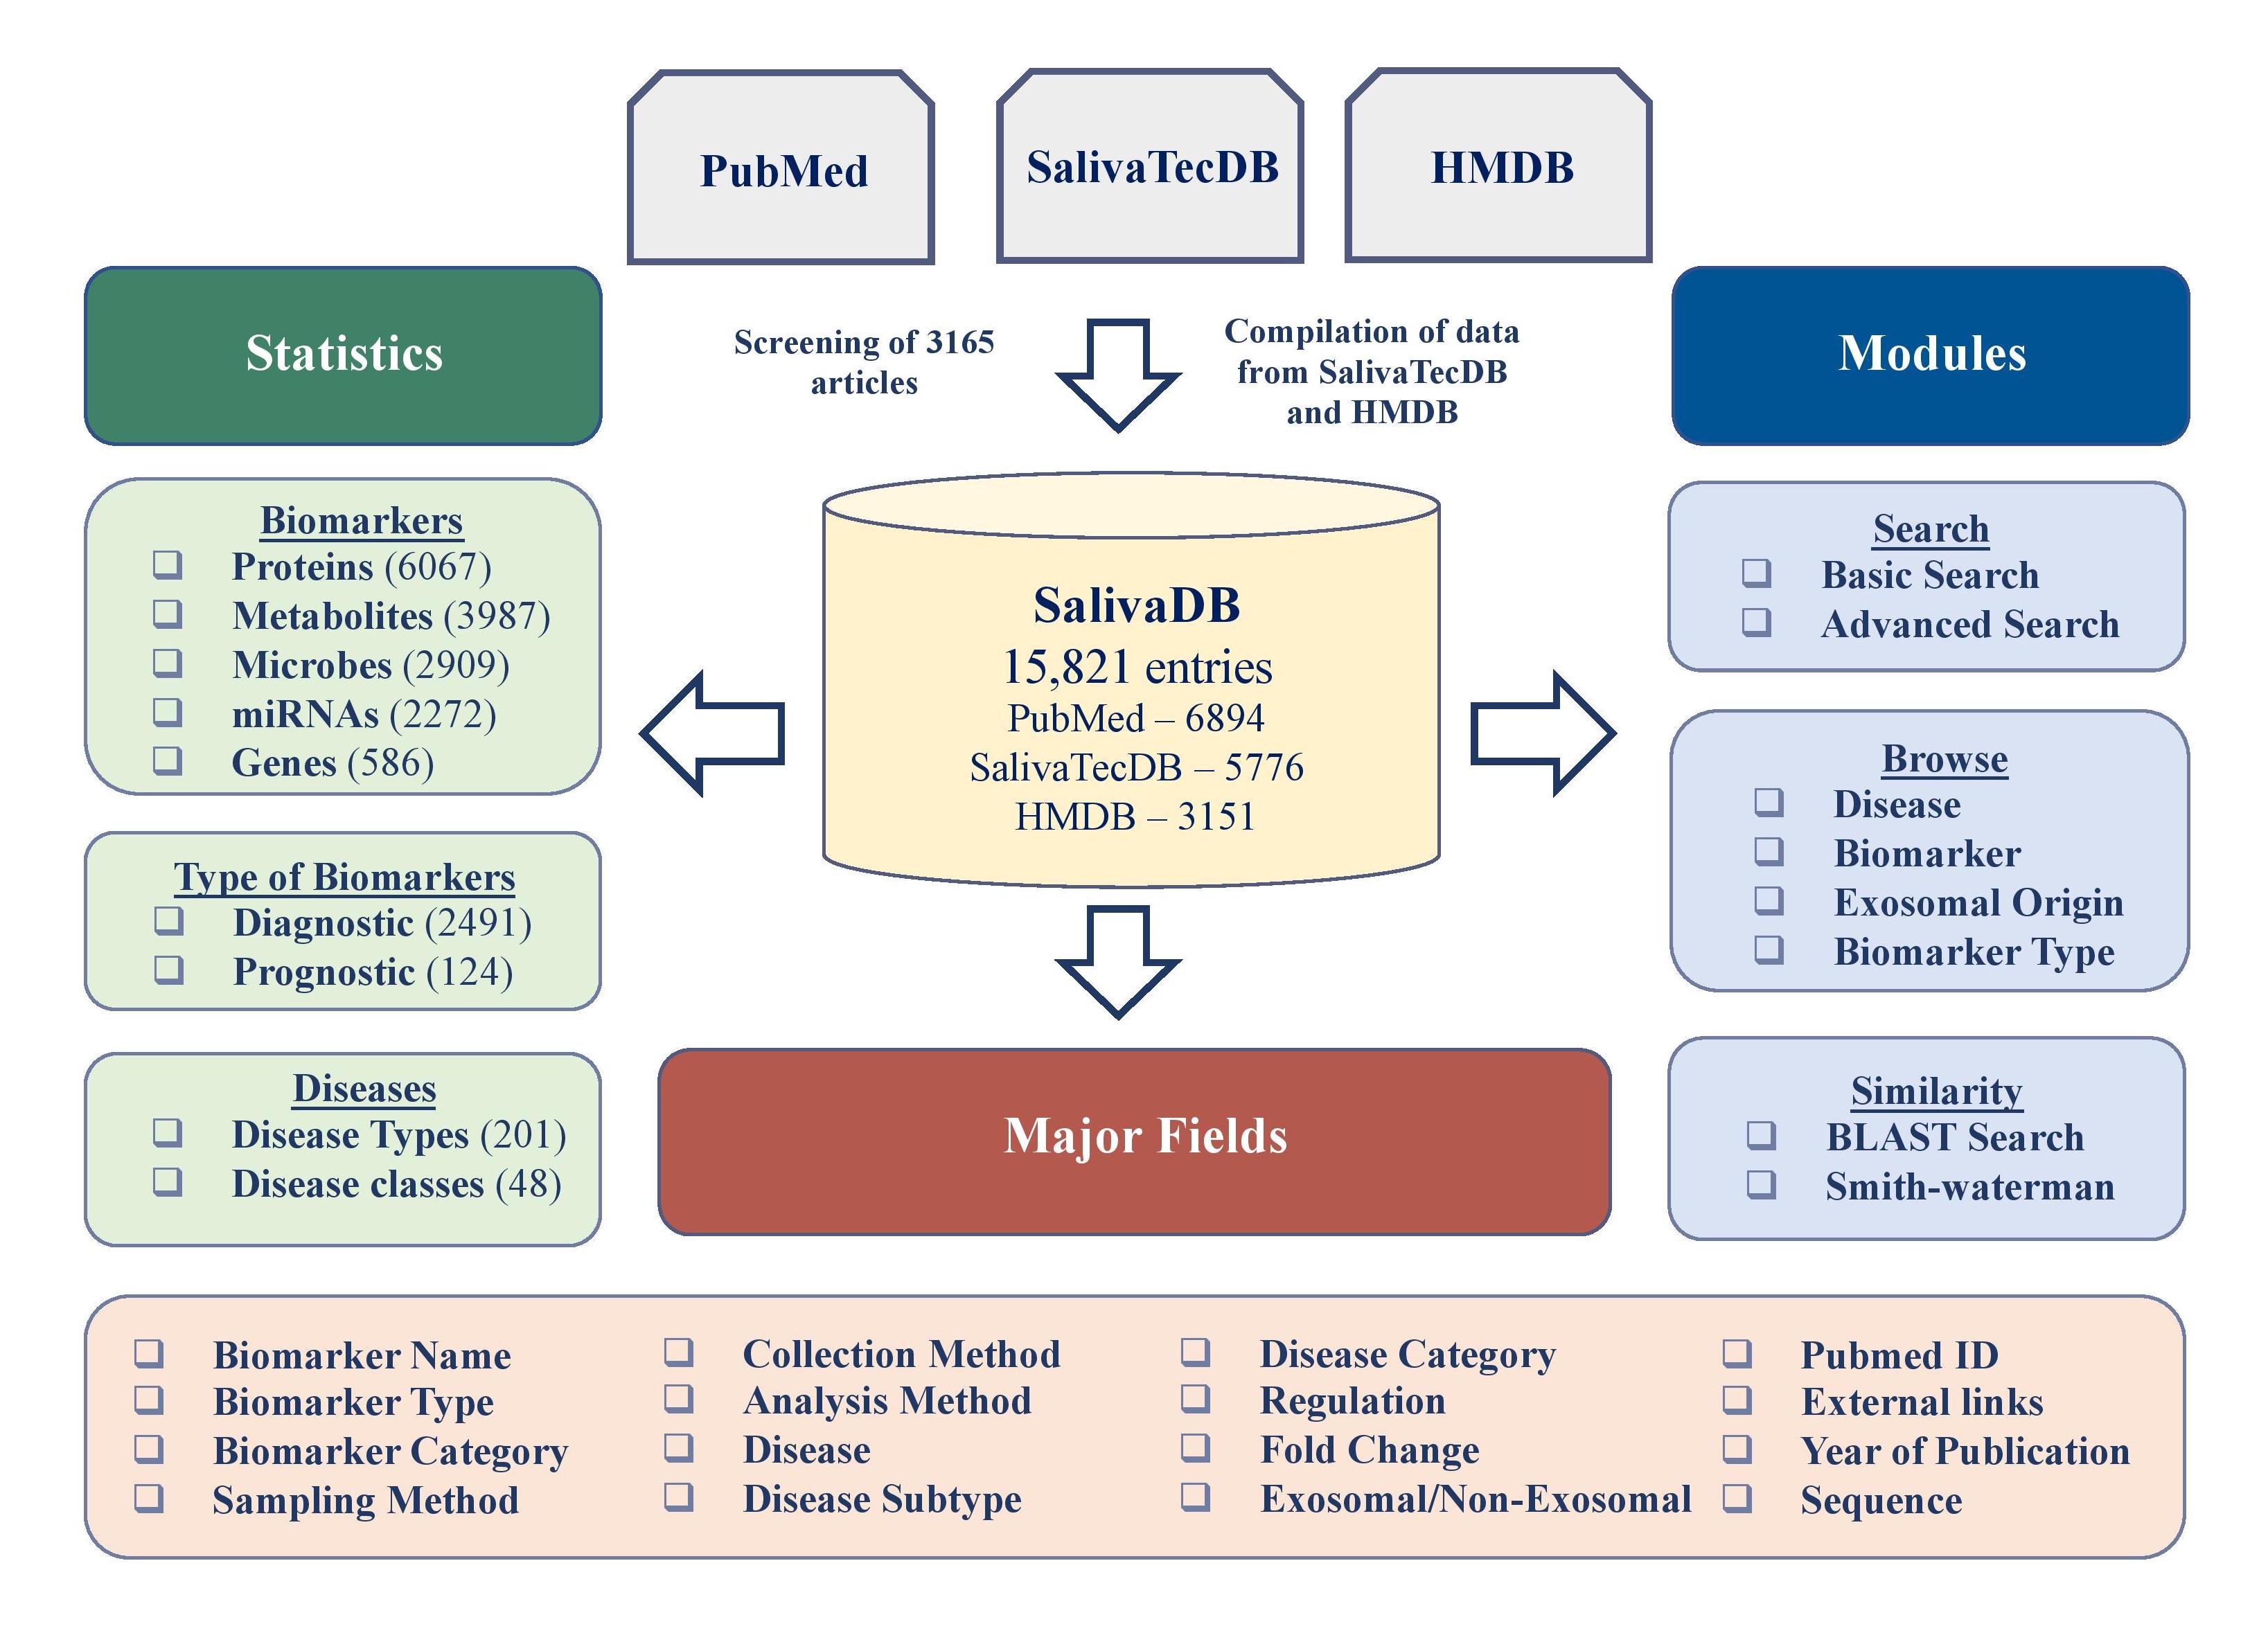
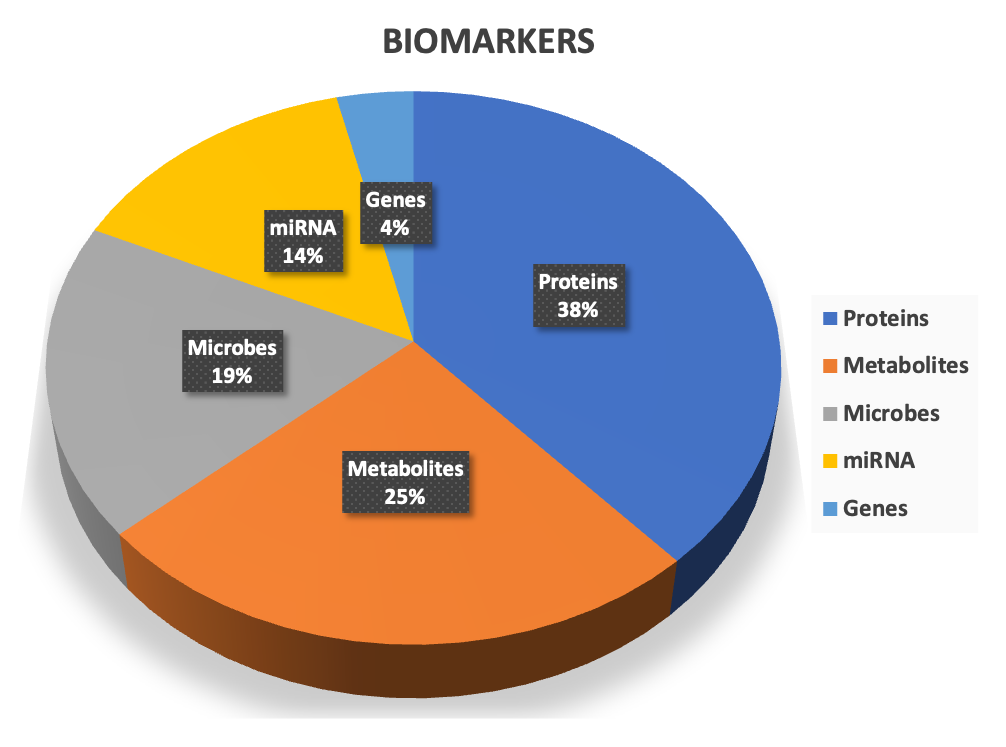
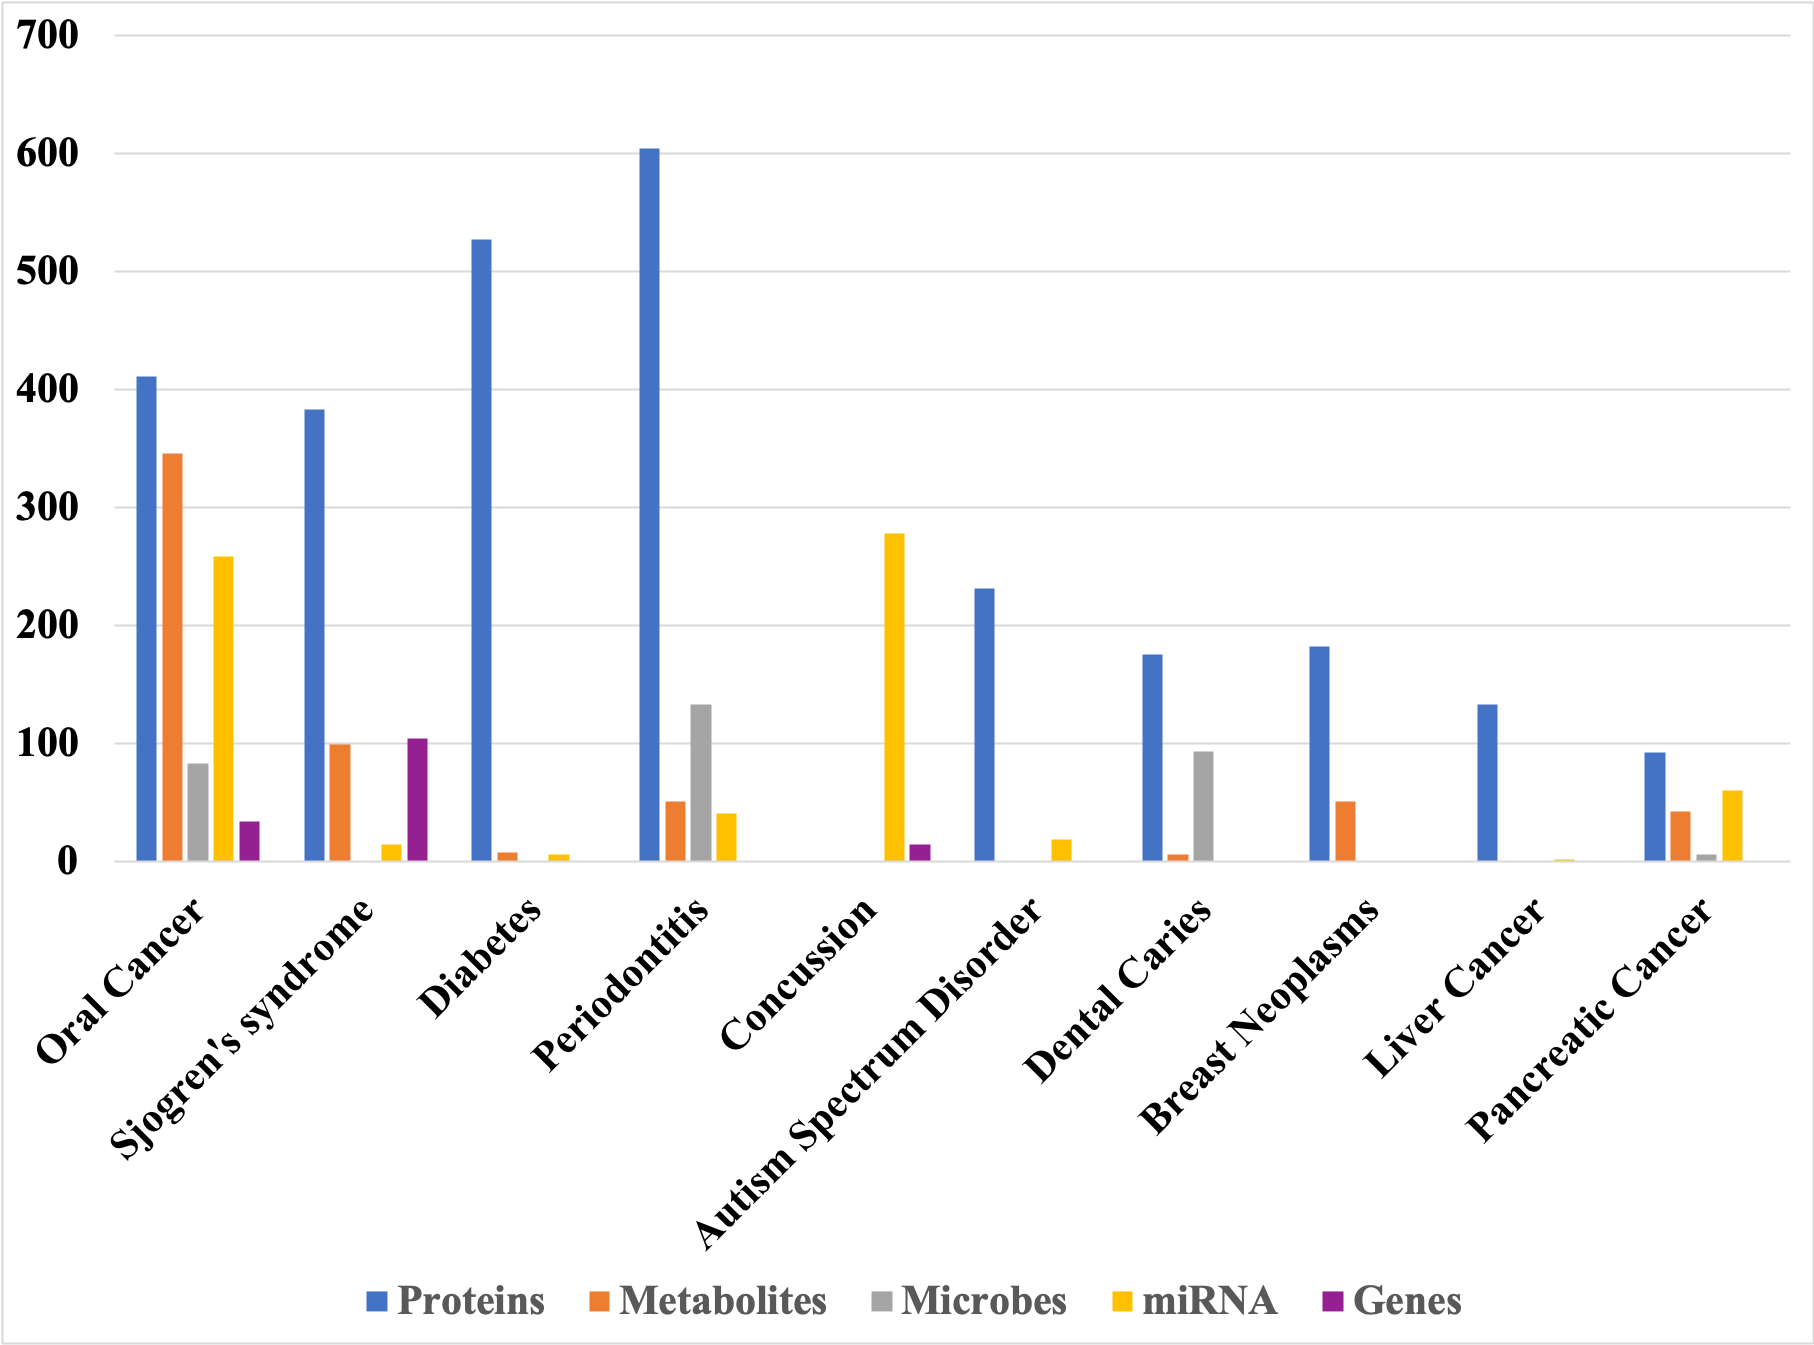
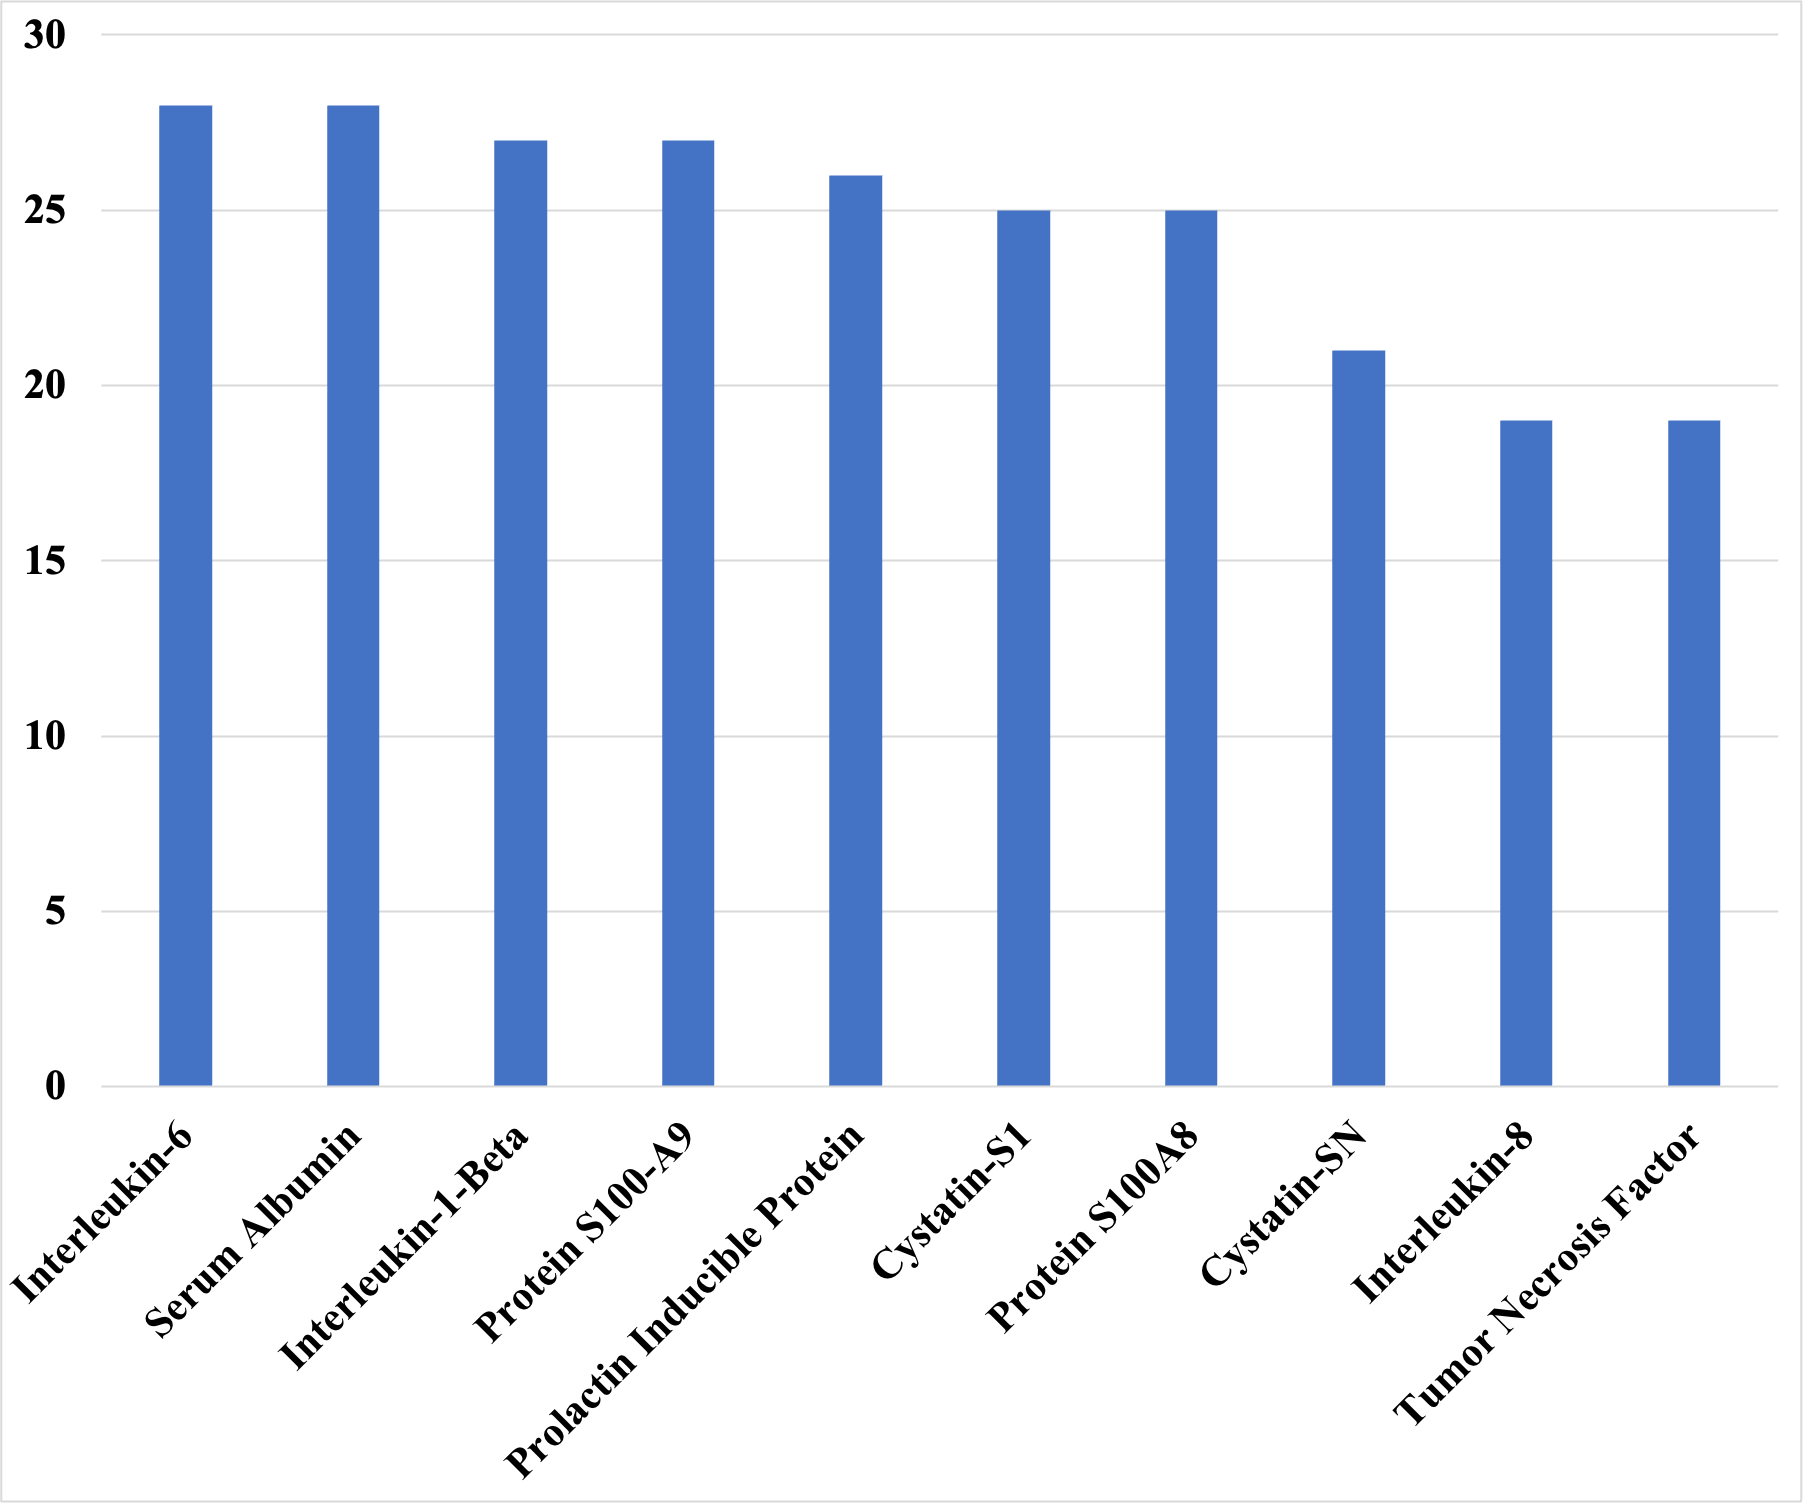
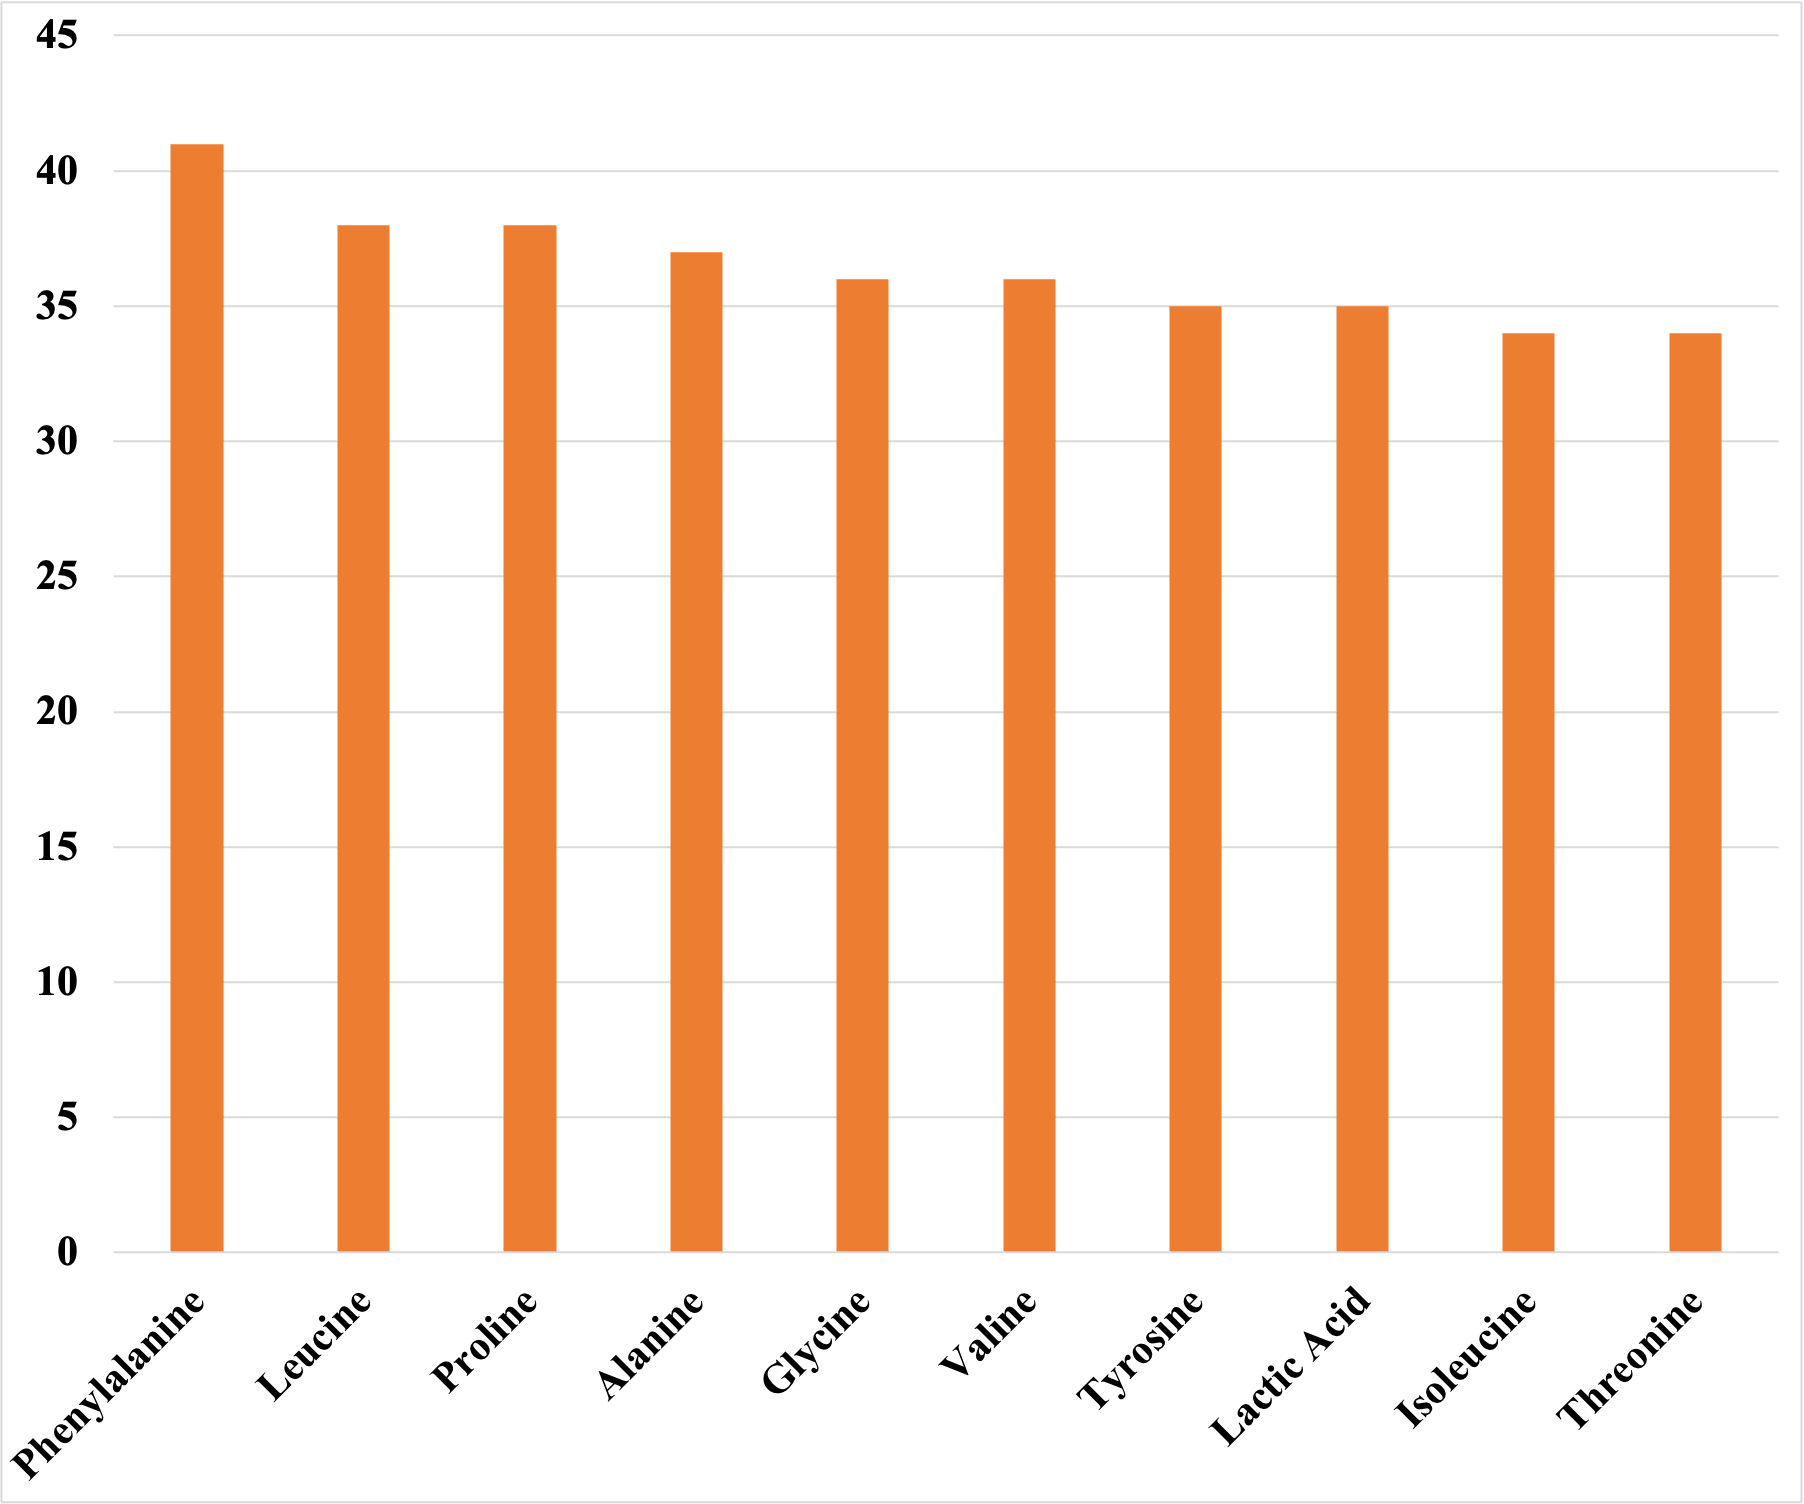
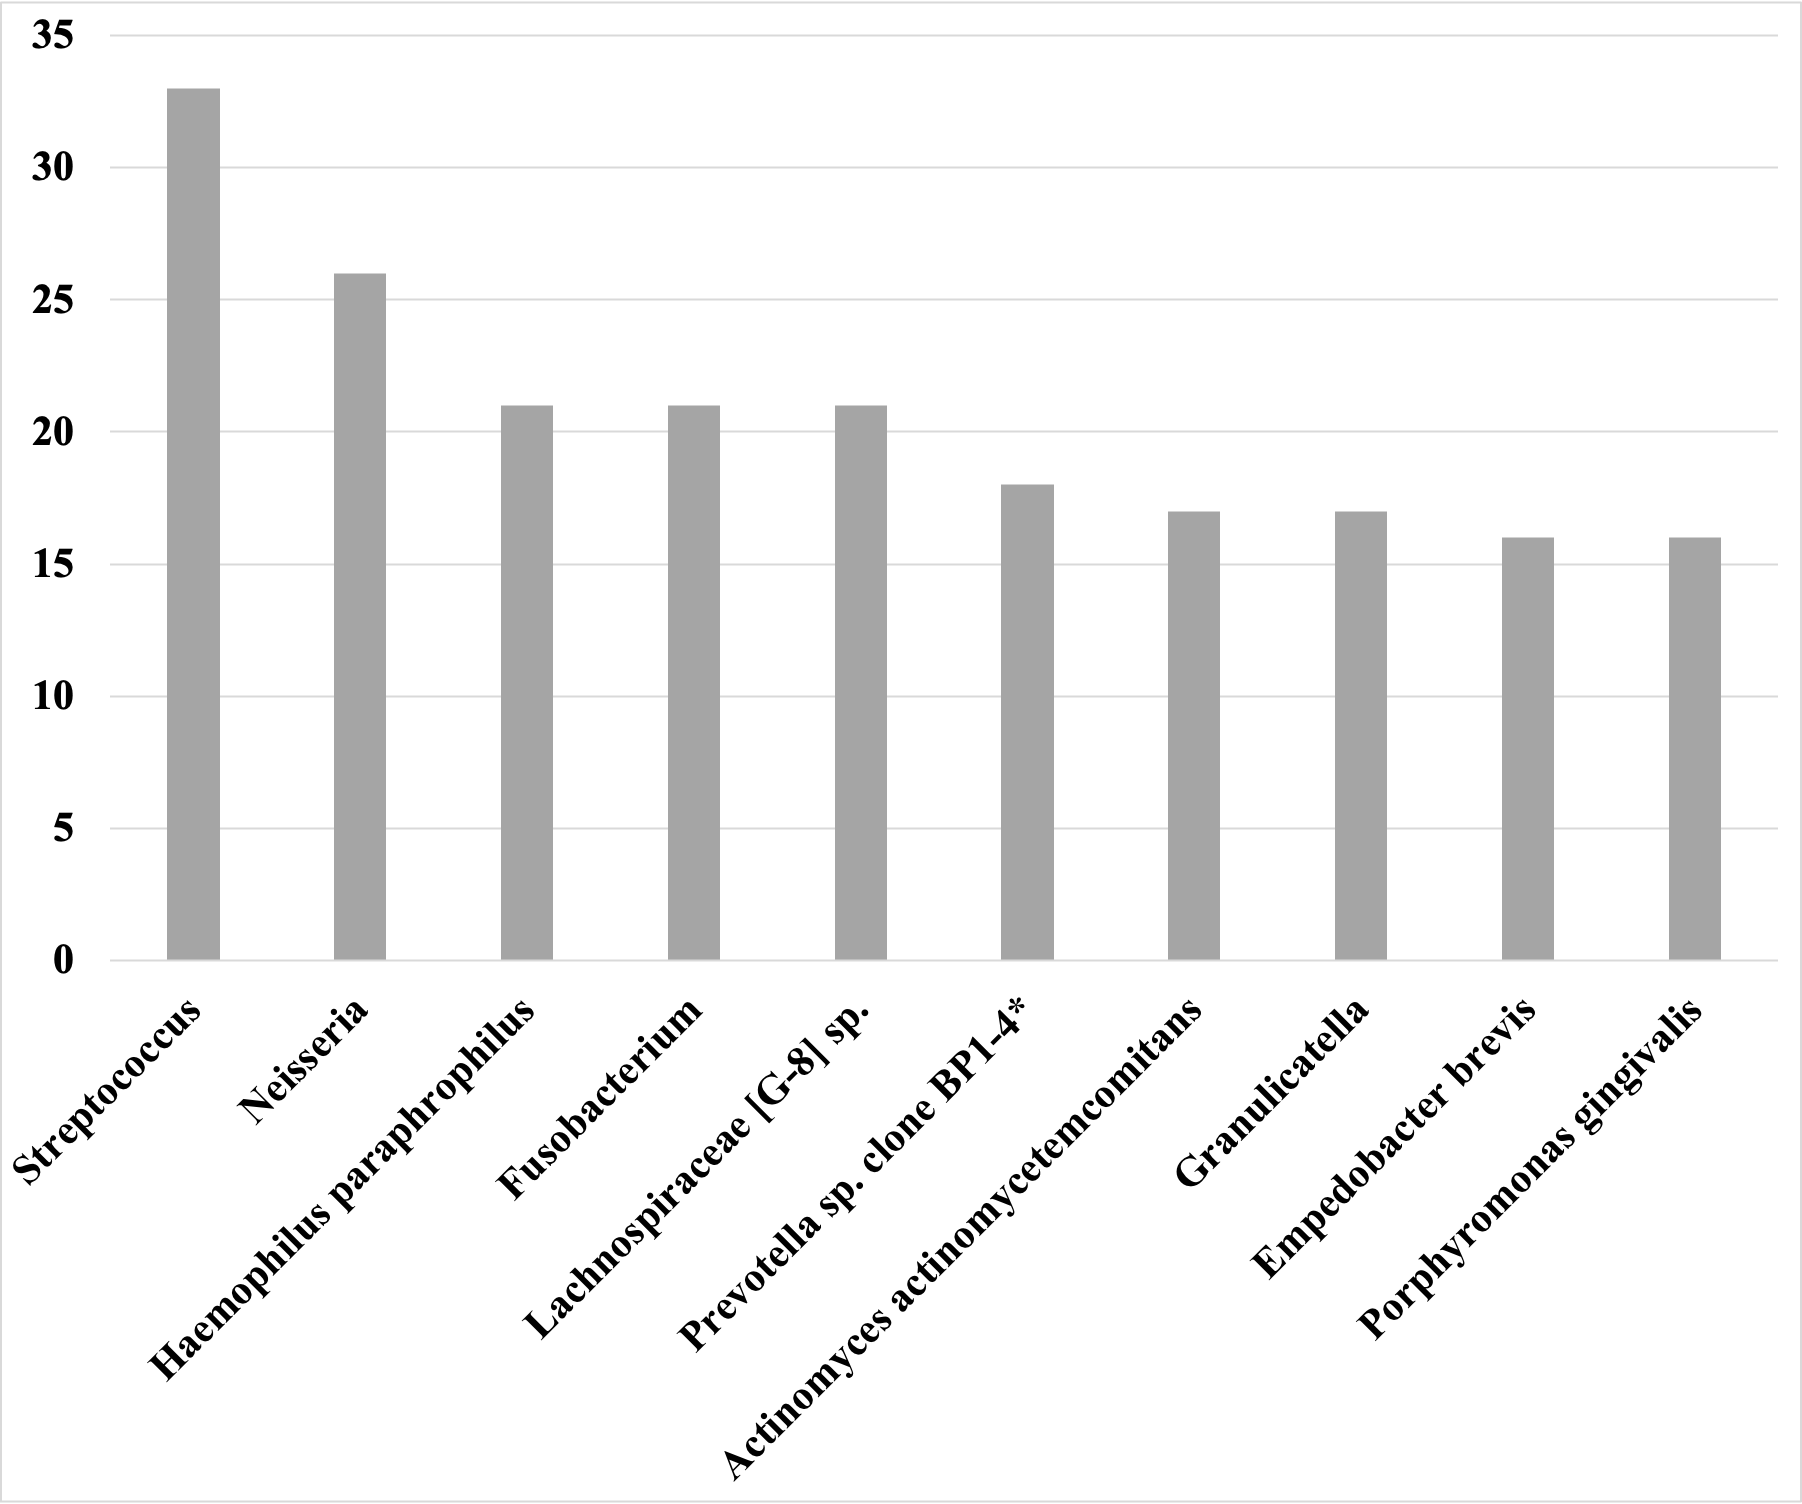
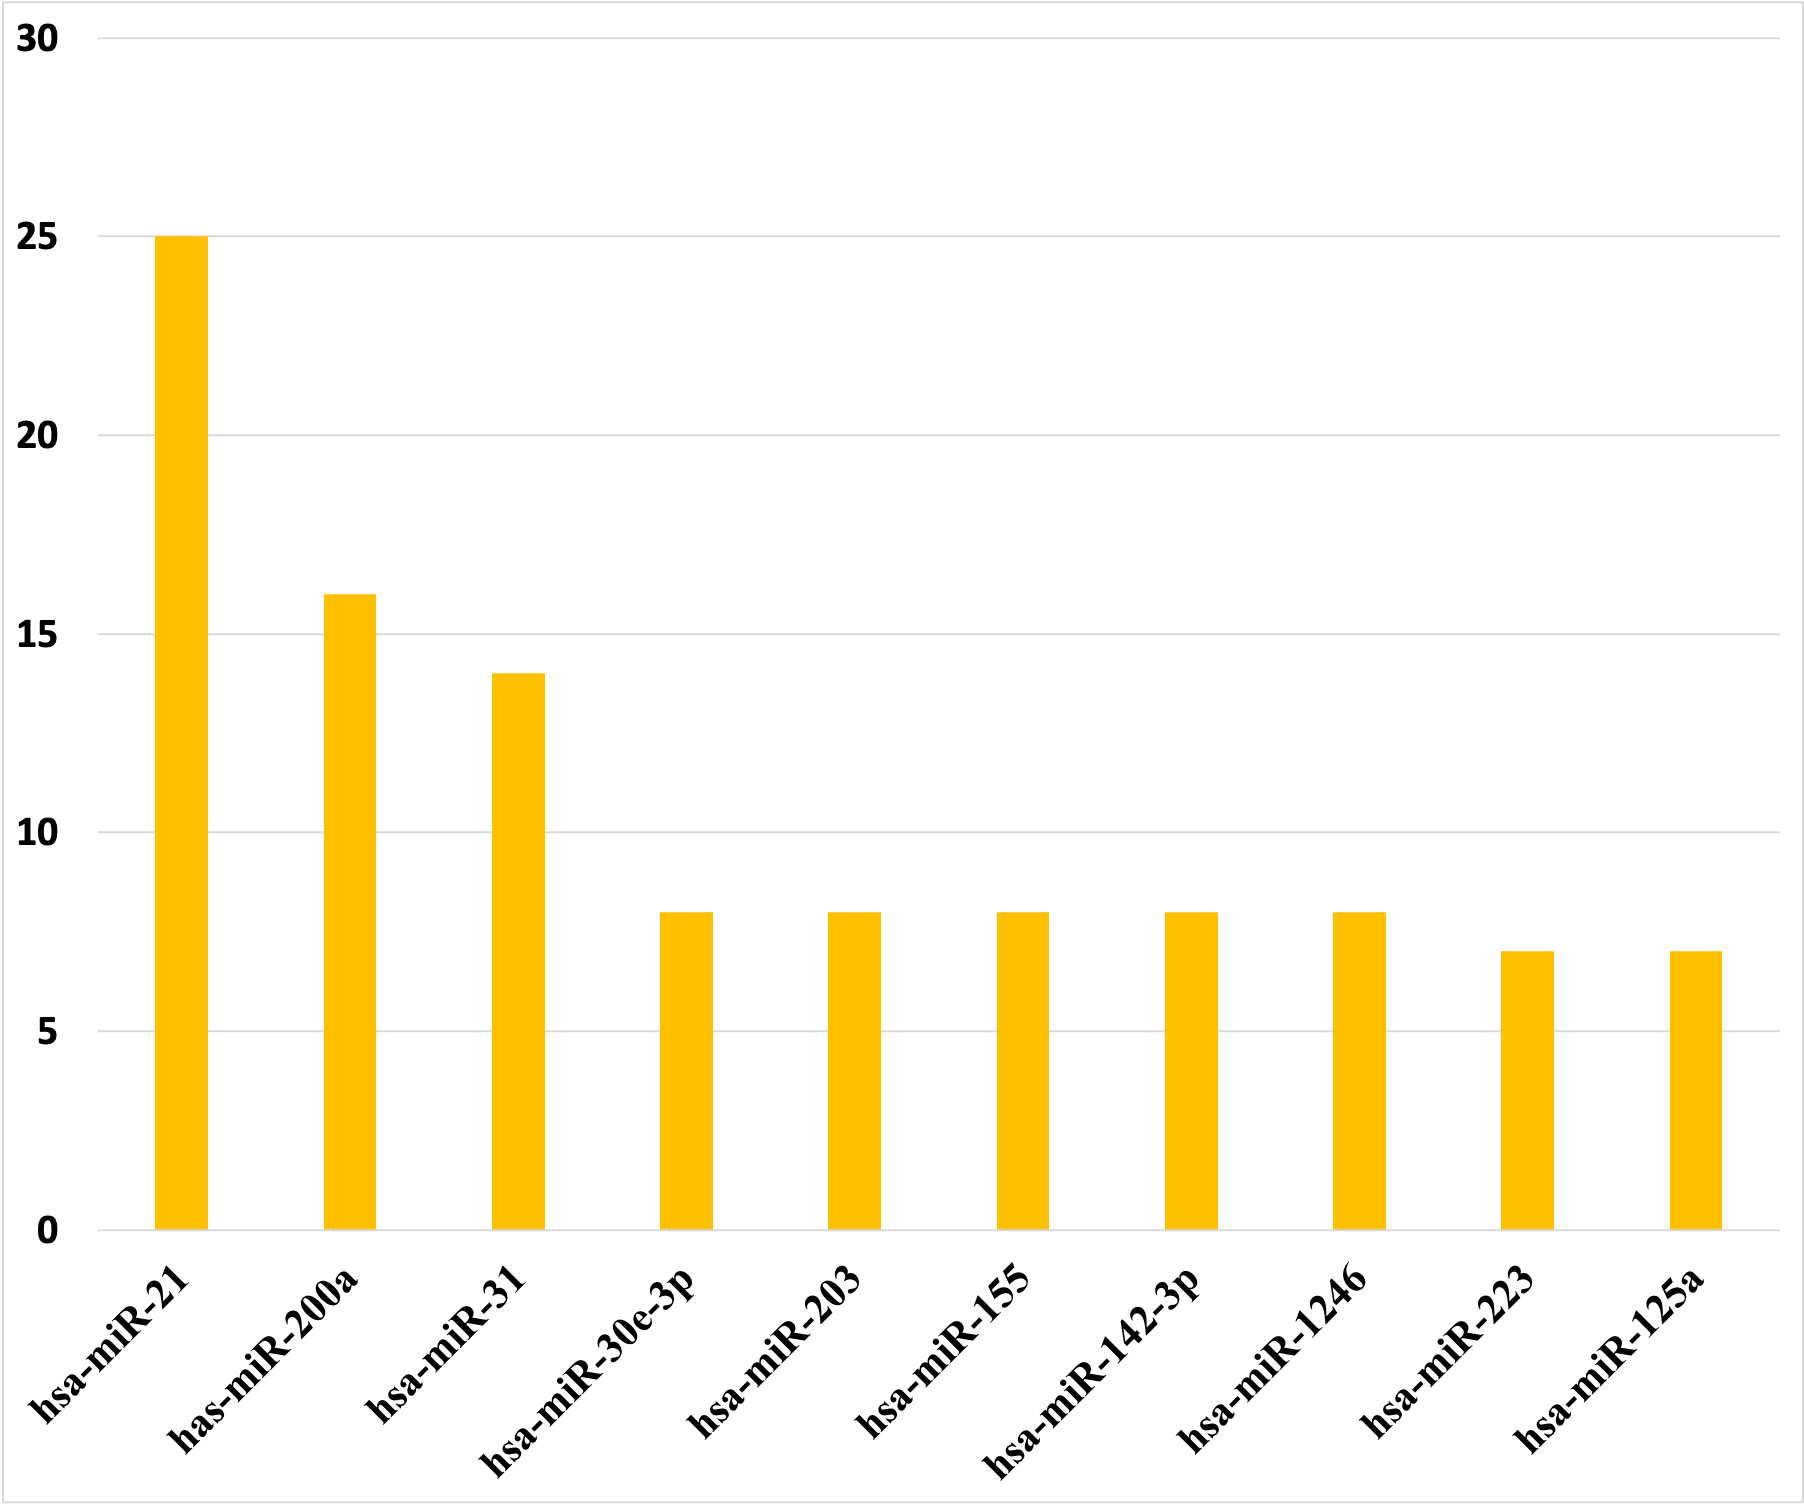
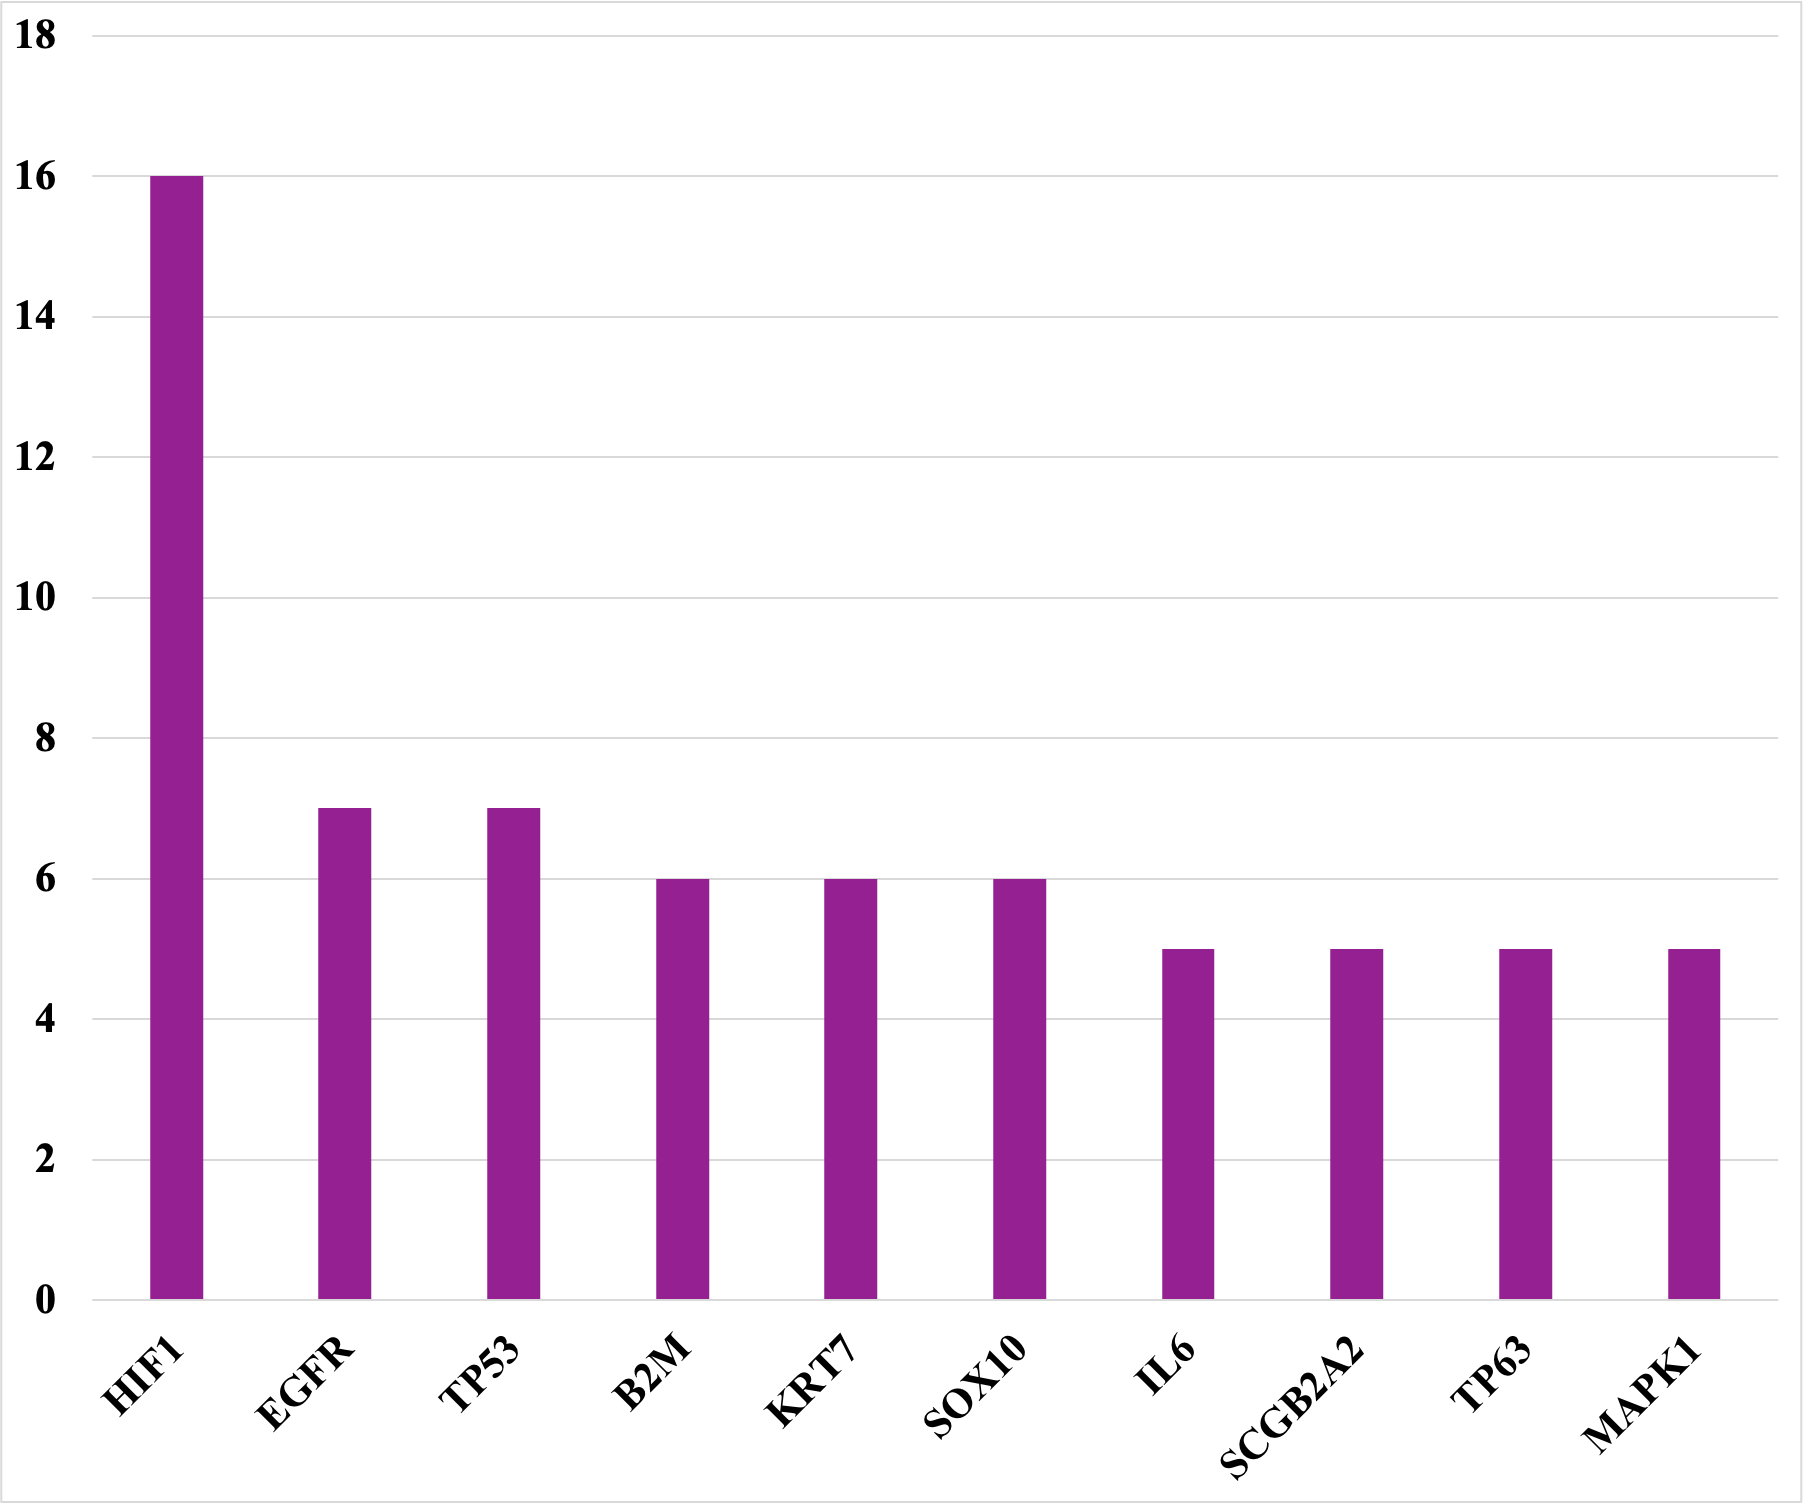
Figure 1: Represents the architecture of SalivaDBFigure 2: Represents the percentage distribution of Salivary Biomarkers in SalivaDBFigure 3: Represents the top 10 diseases for which salivary biomarkers are found in SalivaDB (based on number of entries)Figure 4: Represents the top 10 salivary proteins based on number of entries found in SalivaDBFigure 5: Represents the top 10 salivary metabolites based on number of entries found in SalivaDBFigure 6: Represents the top 10 salivary microbes based on number of entries found in SalivaDBFigure 7: Represents the top 10 salivary miRNA based on number of entries found in SalivaDBFigure 8: Represents the top 10 salivary genes based on number of entries found in SalivaDB