Help Page of CancerCSP |
| CancerCSP (clear cell renal cancer stage prediction) is a web-bench developed for predicting Early and Late stage of clear cell renal cell carcinoma (ccRCC) patients using gene expression data derived from RNA-seq experiments in the form of RNA-Seq by Expectation Maximization (RSEM) values. The user can also analyze data regarding expression of a gene in early and late stage of ccRCC for any gene among 20,531 genes included in TCGA analysis. The models used in this study were trained on TCGA genomics Level 3 data for cancer patients of 519 cancer patients. We are able to discriminate early and late stage patients with accuracy of 72.64% with ROC of 0.78 on validation dataset. |
| |
PREDICTION |
| Predict Biomarkers for Single Patient (8 gene dataset) |
| This module allows the users to submit RSEM values of genes and predict if the cancer patient has Early Stage cancer or Late Stage cancer using gene expression data of 8 genes, resulting from threshold based analysis of RNA-seq data of KIRC from TCGA data. This method requires RSEM values of 8 genes in each patient to predict whether it’s in early or late stage of cancer. The first column is gene and in second column expression of corresponding gene in a particular number of patients. This tool allows prediction of single patient only. |
| |
 |
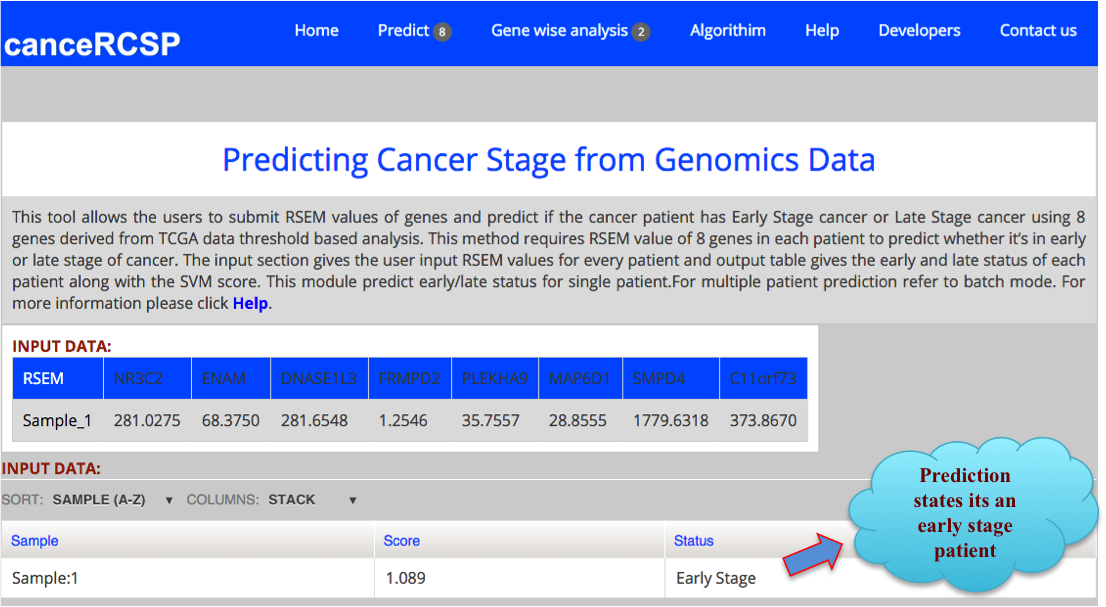
The result Page shows like the following. The result Page provides the output predicting if a sample is in Early stage or Late stage of clear cell renal carcinoma using 8 gene dataset with their corresponding score. |
 |
| |
| Predict Biomarkers for Single Patient (10 gene dataset) |
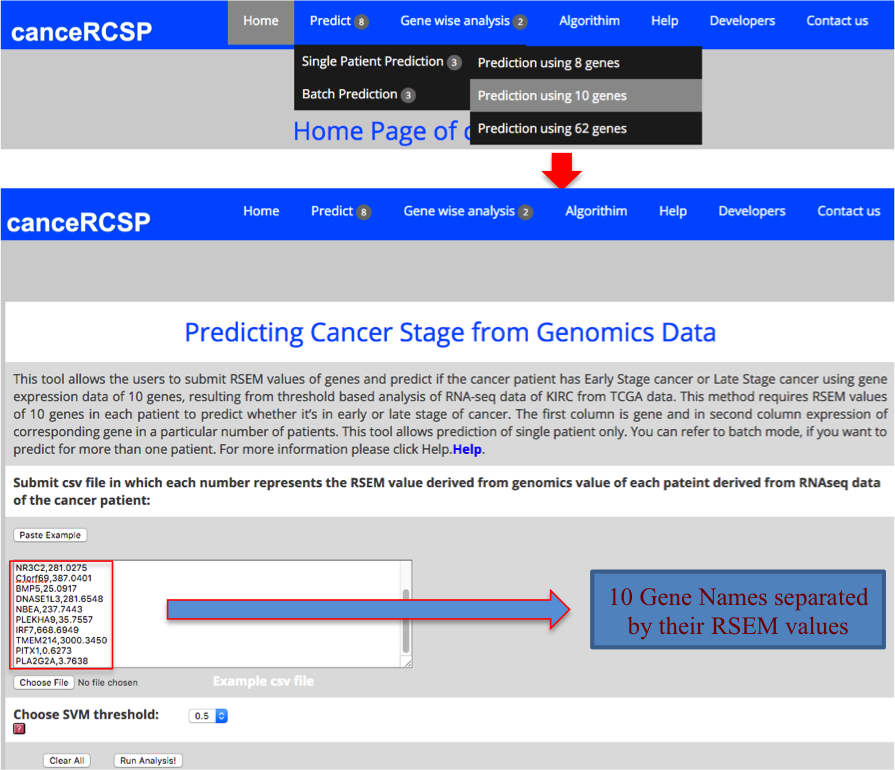
| This module allows the users to submit RSEM values of genes and predict if the cancer patient has Early Stage cancer or Late Stage cancer using gene expression data of 10 genes, resulting from threshold based analysis of RNA-seq data of KIRC from TCGA data. This method requires RSEM values of 10 genes in each patient to predict whether it’s in early or late stage of cancer. The first column is gene and in second column expression of corresponding gene in a particular number of patients. This tool allows prediction of single patient only. |
| |
 |
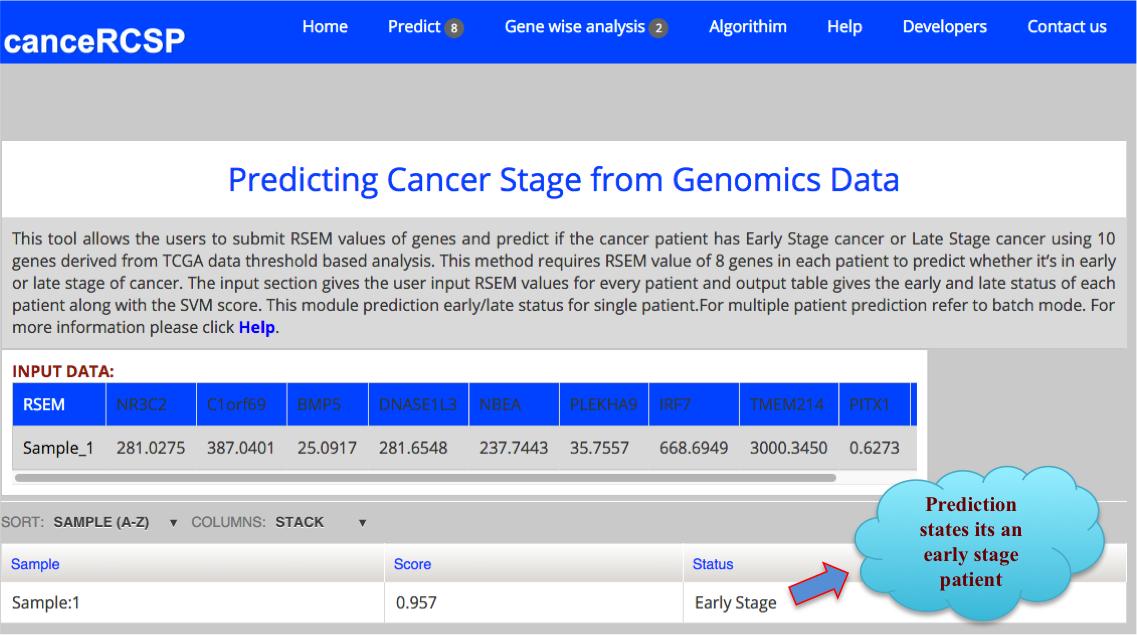
The result Page shows like the following. The result Page provides the output predicting if a sample is in Early stage or Late stage of clear cell renal carcinoma using 10 gene dataset with their corresponding score. |
 |
| |
| Predict Biomarkers for Single Patient (62 gene dataset) |
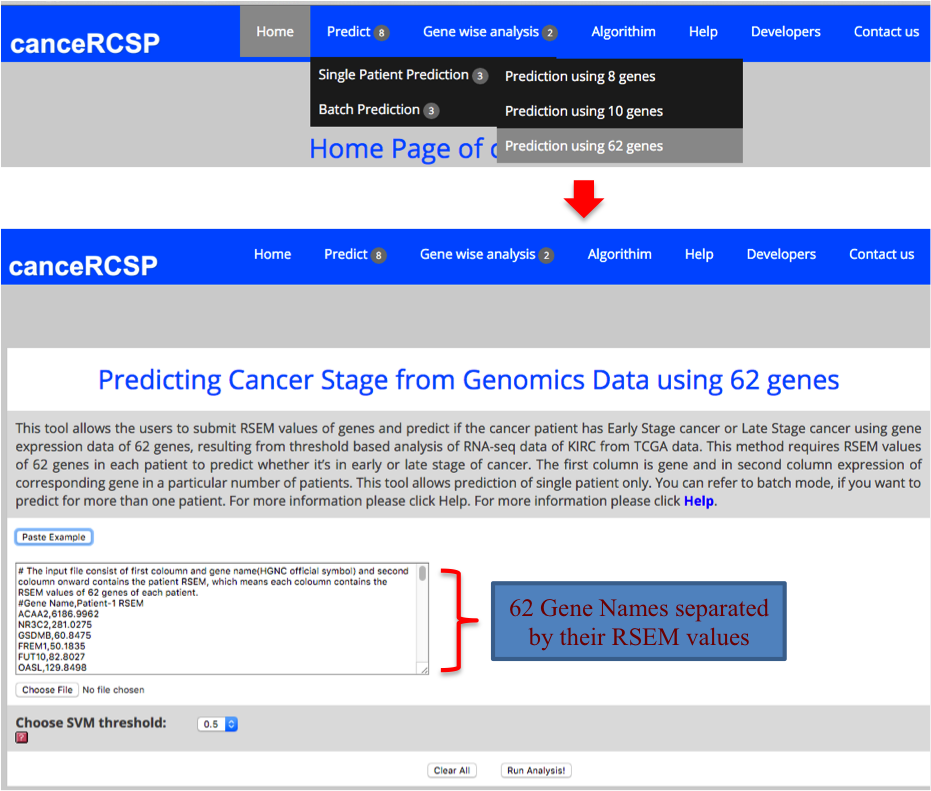
| This module allows the users to submit RSEM values of genes and predict if the cancer patient has Early Stage cancer or Late Stage cancer using gene expression data of 62 genes, resulting from threshold based analysis of RNA-seq data of KIRC from TCGA data. This method requires RSEM values of 62 genes in each patient to predict whether it’s in early or late stage of cancer. The first column is gene and in second column expression of corresponding gene in a particular number of patients. This tool allows prediction of single patient only. |
| |
 |
The result Page shows like the following. The result Page provides the output predicting if a sample is in Early stage or Late stage of clear cell renal carcinoma using 62 gene dataset with their corresponding score. |
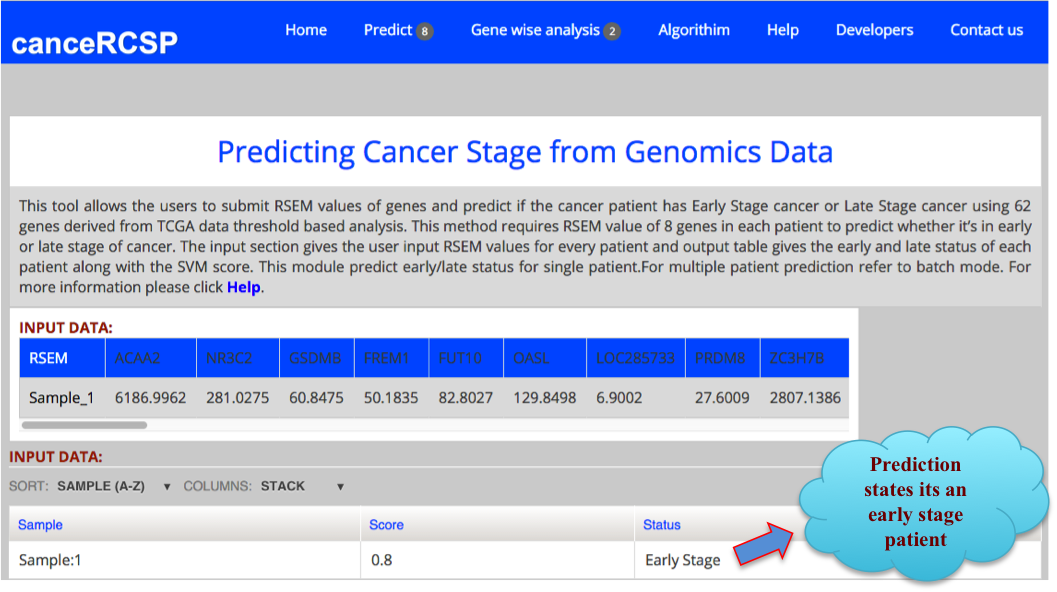 |
| |
| Predict Biomarkers for Multiple Patients (8 gene dataset) |
| This module allows the users to submit RSEM values of genes and predict if the cancer patient has Early Stage cancer or Late Stage cancer using gene expression data of 8 genes, resulting from threshold based analysis of RNA-seq data of KIRC from TCGA data. This method requires RSEM values of 8 genes in each patient to predict whether it’s in early or late stage of cancer. The first column is gene and in second column expression of corresponding gene in a particular number of patients. This tool allows prediction for multiple patients. |
| |
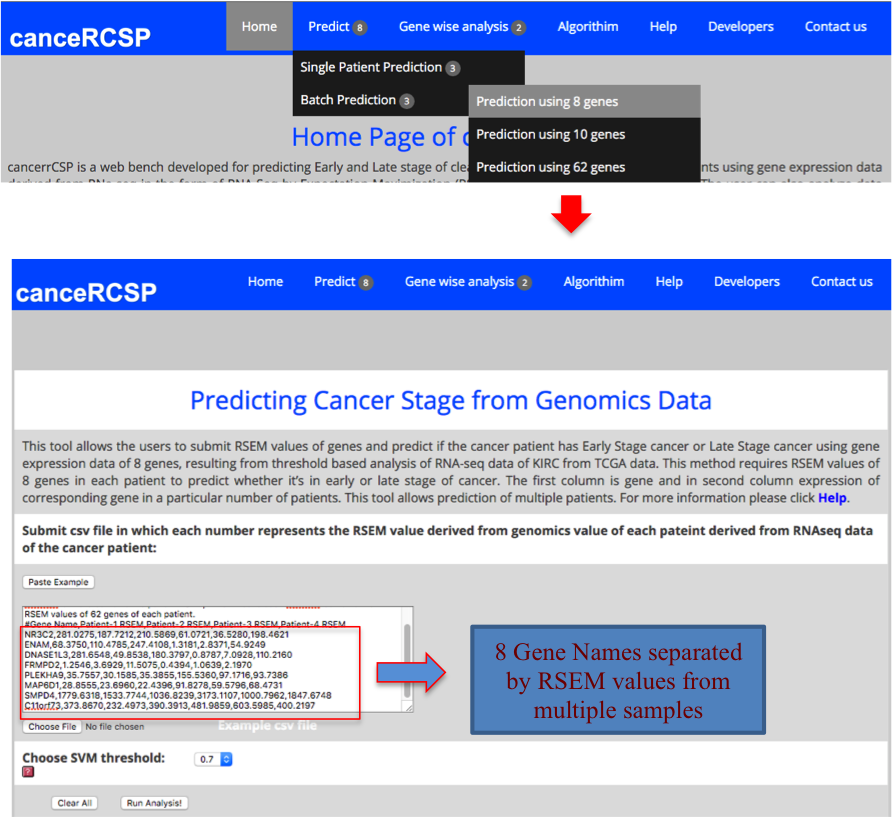 |
The result Page shows like the following. The result Page provides the output predicting if a sample is in Early stage or Late stage of clear cell renal carcinoma using 8 gene dataset with their corresponding score. |
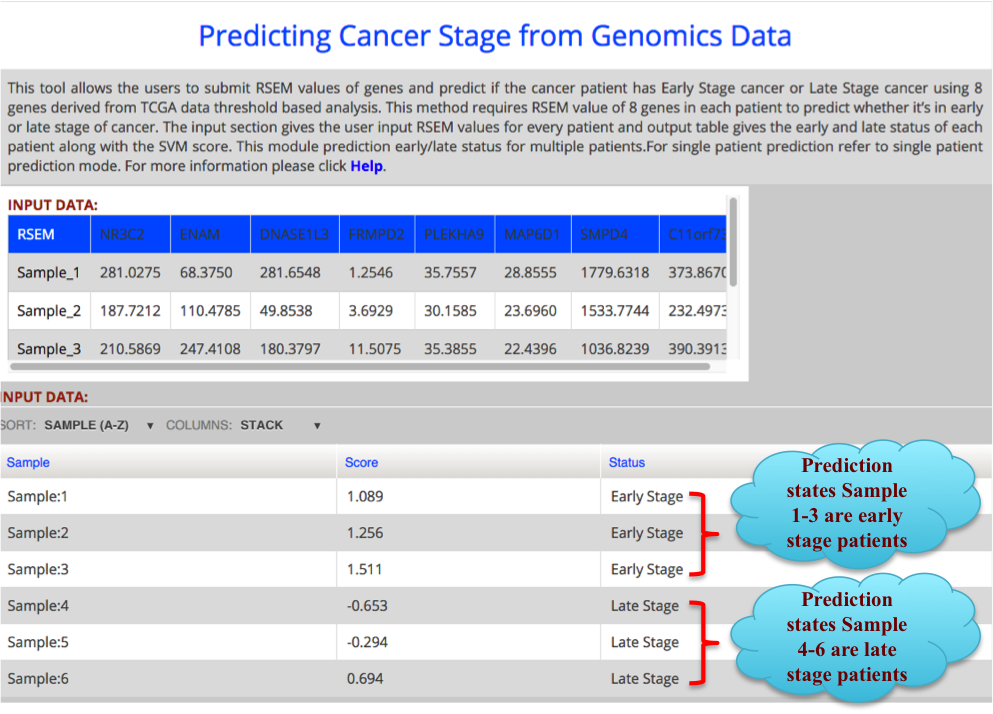 |
| |
| Predict Biomarkers for Multiple Patients (10 gene dataset) |
| This module allows the users to submit RSEM values of genes and predict if the cancer patient has Early Stage cancer or Late Stage cancer using gene expression data of 10 genes, resulting from threshold based analysis of RNA-seq data of KIRC from TCGA data. This method requires RSEM values of 10 genes in each patient to predict whether it’s in early or late stage of cancer. The first column is gene and in second column expression of corresponding gene in a particular number of patients. This tool allows prediction for multiple patients. |
| |
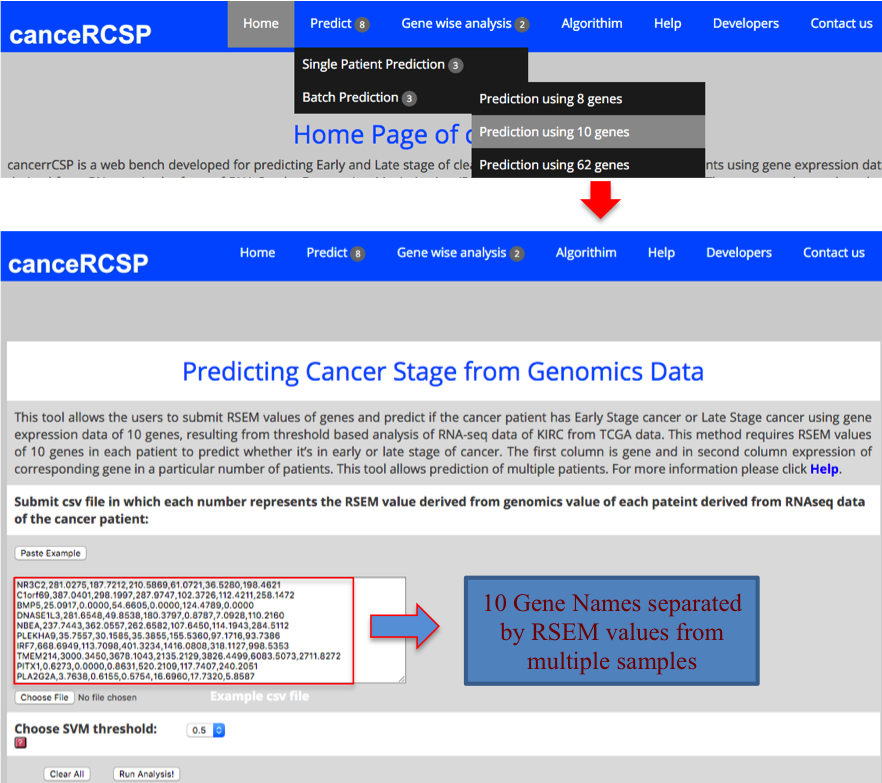 |
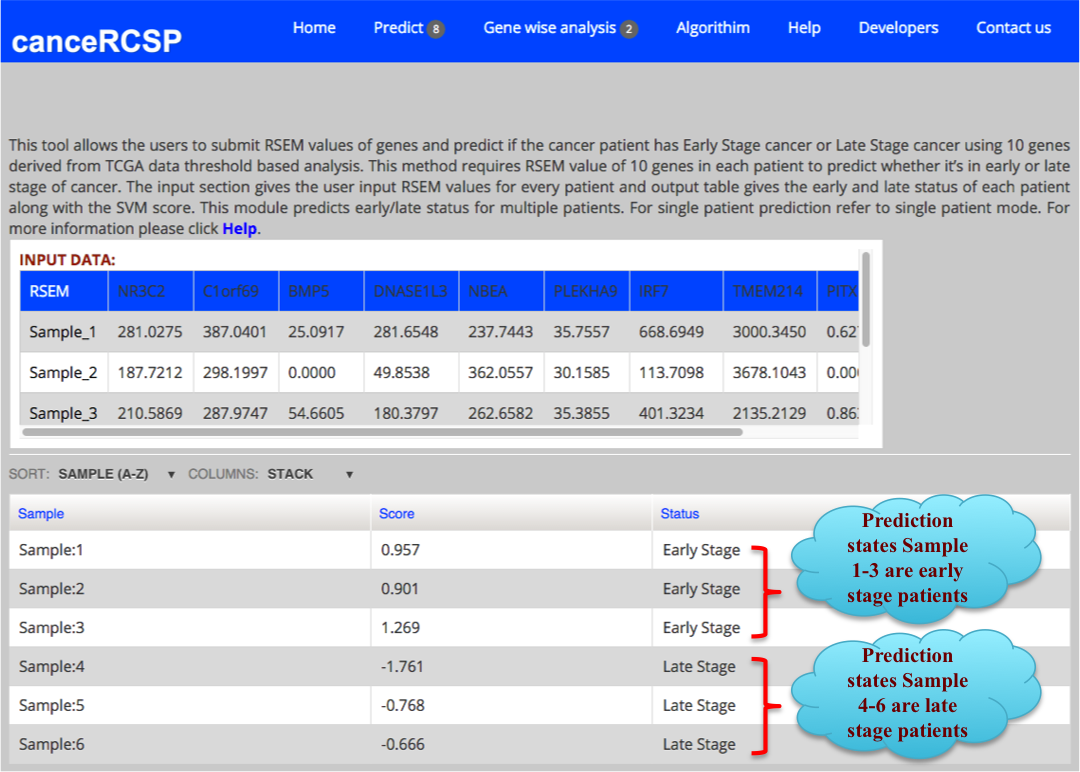
The result Page shows like the following. The result Page provides the output predicting if a sample is in Early stage or Late stage of clear cell renal carcinoma using 10 gene dataset with their corresponding score. |
 |
| |
| Predict Biomarkers for Multiple Patients (62 gene dataset) |
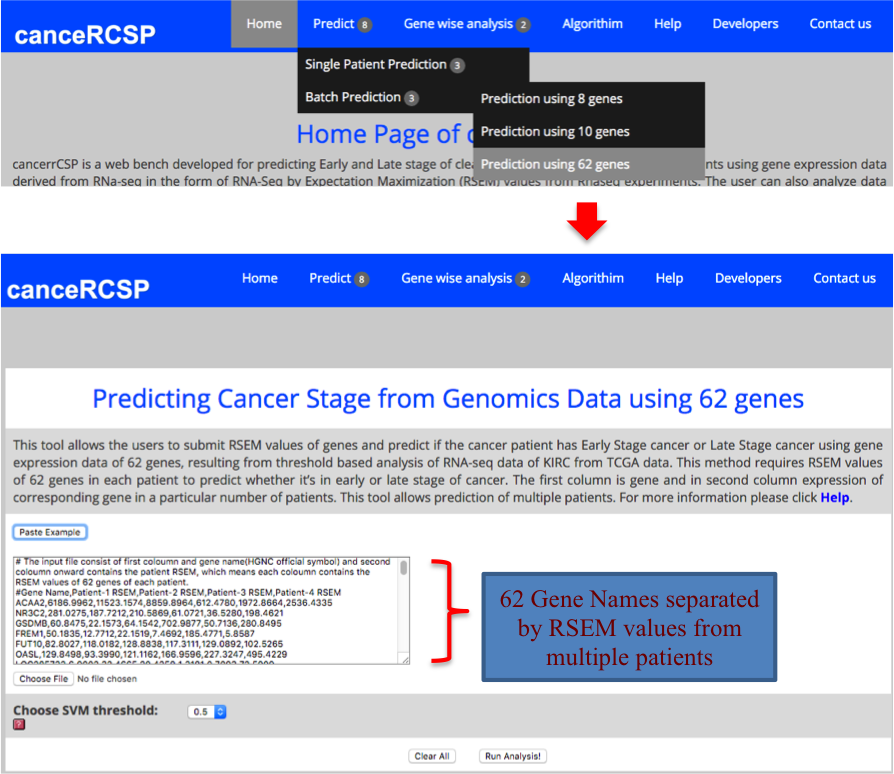
| This module allows the users to submit RSEM values of genes and predict if the cancer patient has Early Stage cancer or Late Stage cancer using gene expression data of 62 genes, resulting from threshold based analysis of RNA-seq data of KIRC from TCGA data. This method requires RSEM values of 62 genes in each patient to predict whether it’s in early or late stage of cancer. The first column is gene and in second column expression of corresponding gene in a particular number of patients. This tool allows prediction for multiple patients. |
| |
 |
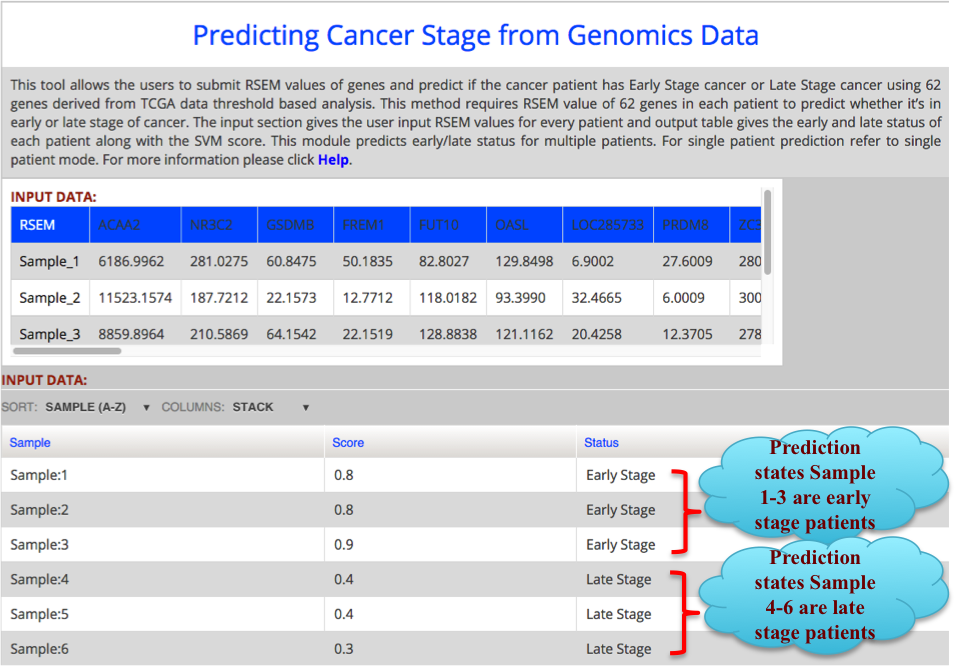
The result Page shows like the following. The result Page provides the output predicting if a sample is in Early stage or Late stage of clear cell renal carcinoma using 62 gene dataset with their corresponding score. |
 |
| |
| Gene-wise Analysis (Single Patient) |
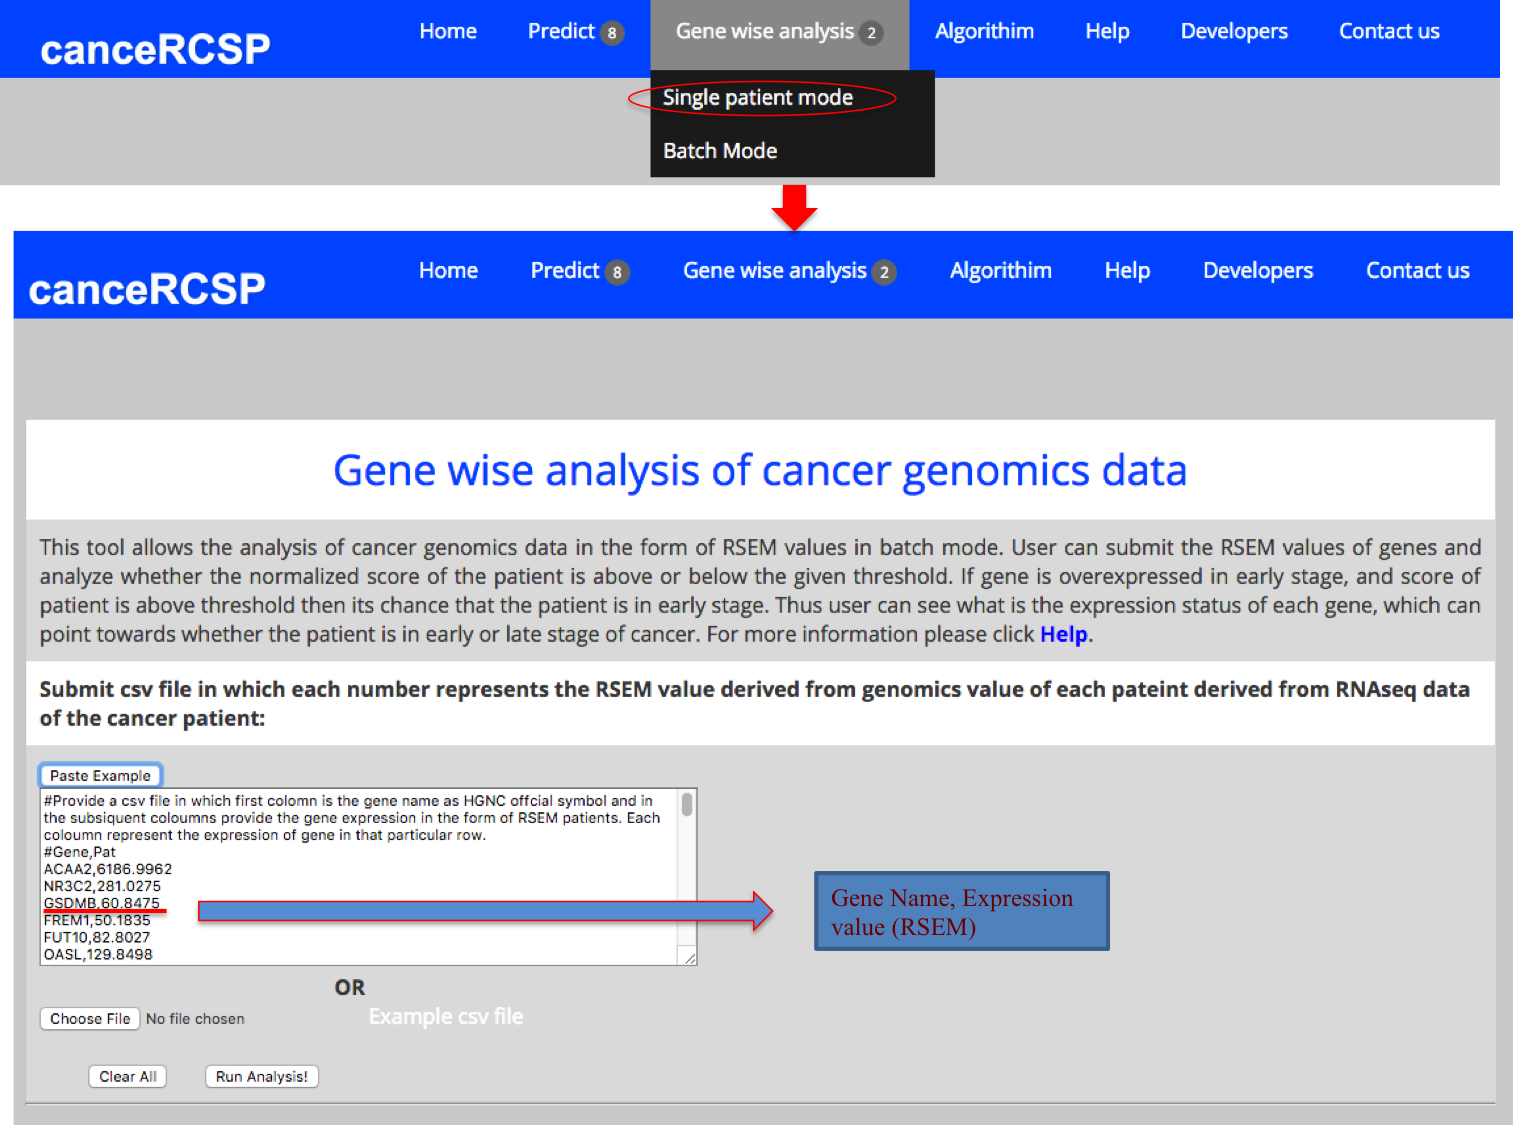
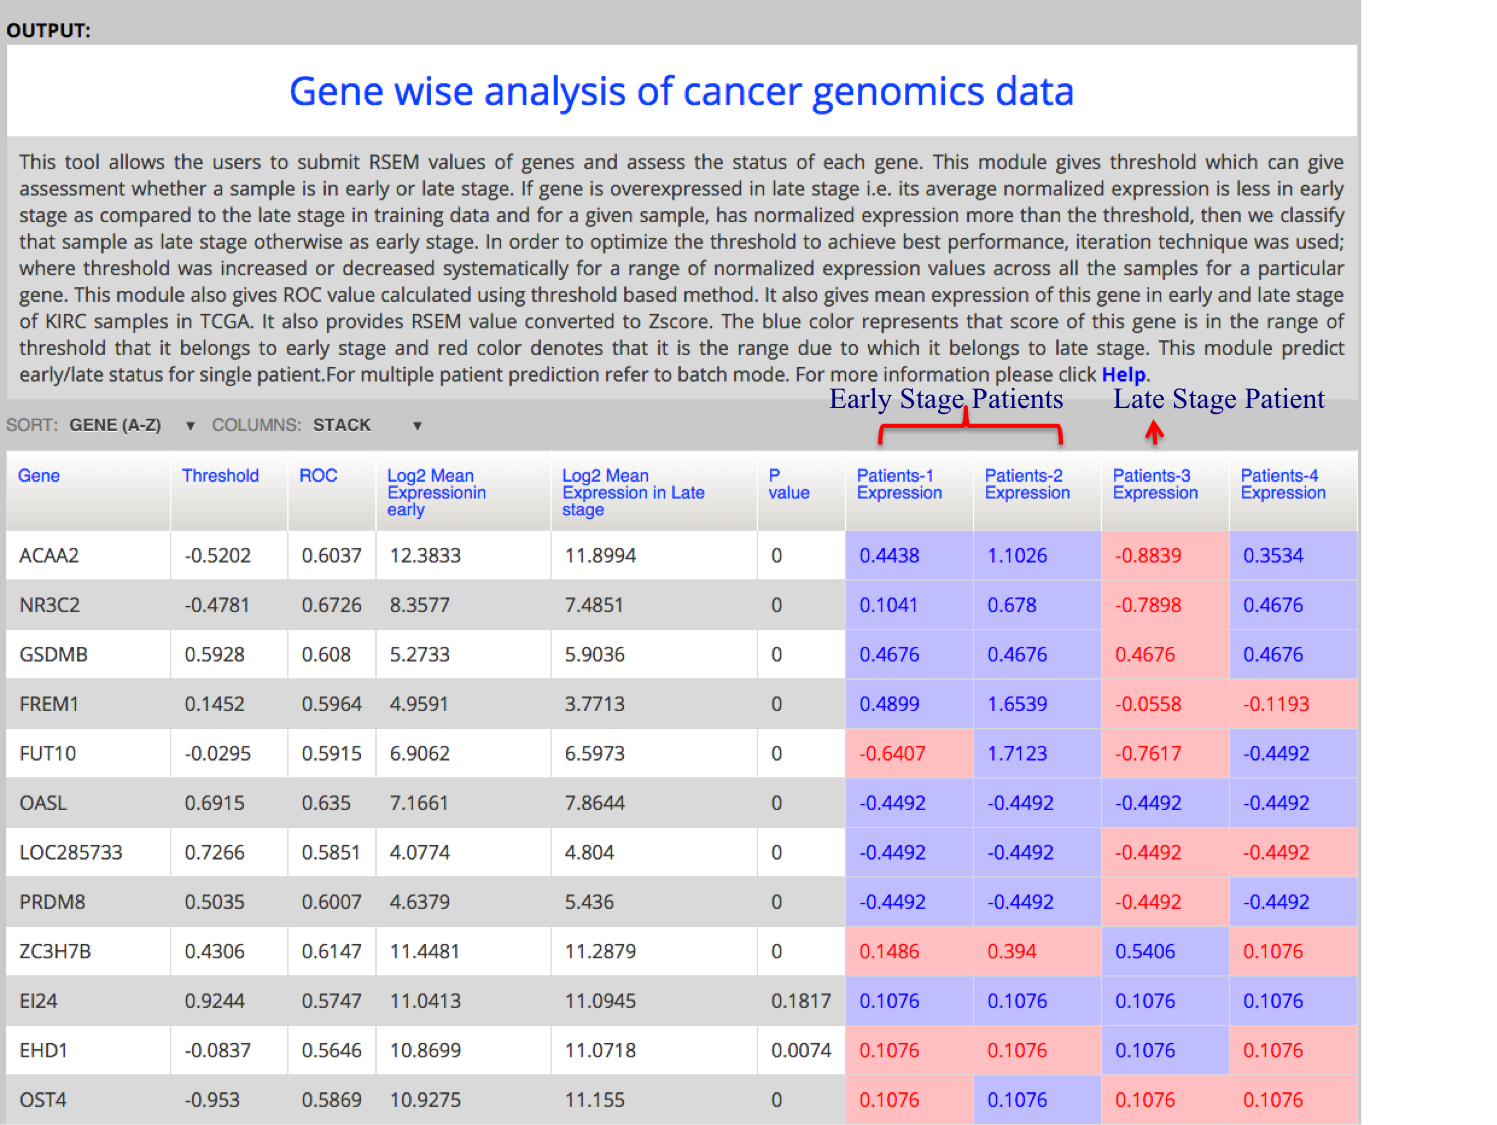
| This module allows the users to submit RSEM values of genes and assess the status of each gene. This module gives threshold which can give assessment whether a sample is in early or late stage. If gene is overexpressed in late stage i.e. its average normalized expression is less in early stage as compared to the late stage in training data and for a given sample, has normalized expression more than the threshold, then we classify that sample as late stage otherwise as early stage. In order to optimize the threshold to achieve best performance, iteration technique was used; where threshold was increased or decreased systematically for a range of normalized expression values across all the samples for a particular gene. This module also gives ROC value calculated using threshold based method. It also gives mean expression of this gene in early and late stage of KIRC samples in TCGA. It also provides RSEM value converted to Zscore. The blue color represents that score of this gene is in the range of threshold that it belongs to early stage and red color denotes that it is the range due to which it belongs to late stage. This module basically predicts the probability of a stage on the basis of expression of a gene. |
| |
 |
The result Page shows like the following.The result Page gives the input data which is provide by the user and the output which predicts if a sample is cancerous or healthy along with the svm score. |
 |
| |
| Gene-wise Analysis (Multiple Patients) |
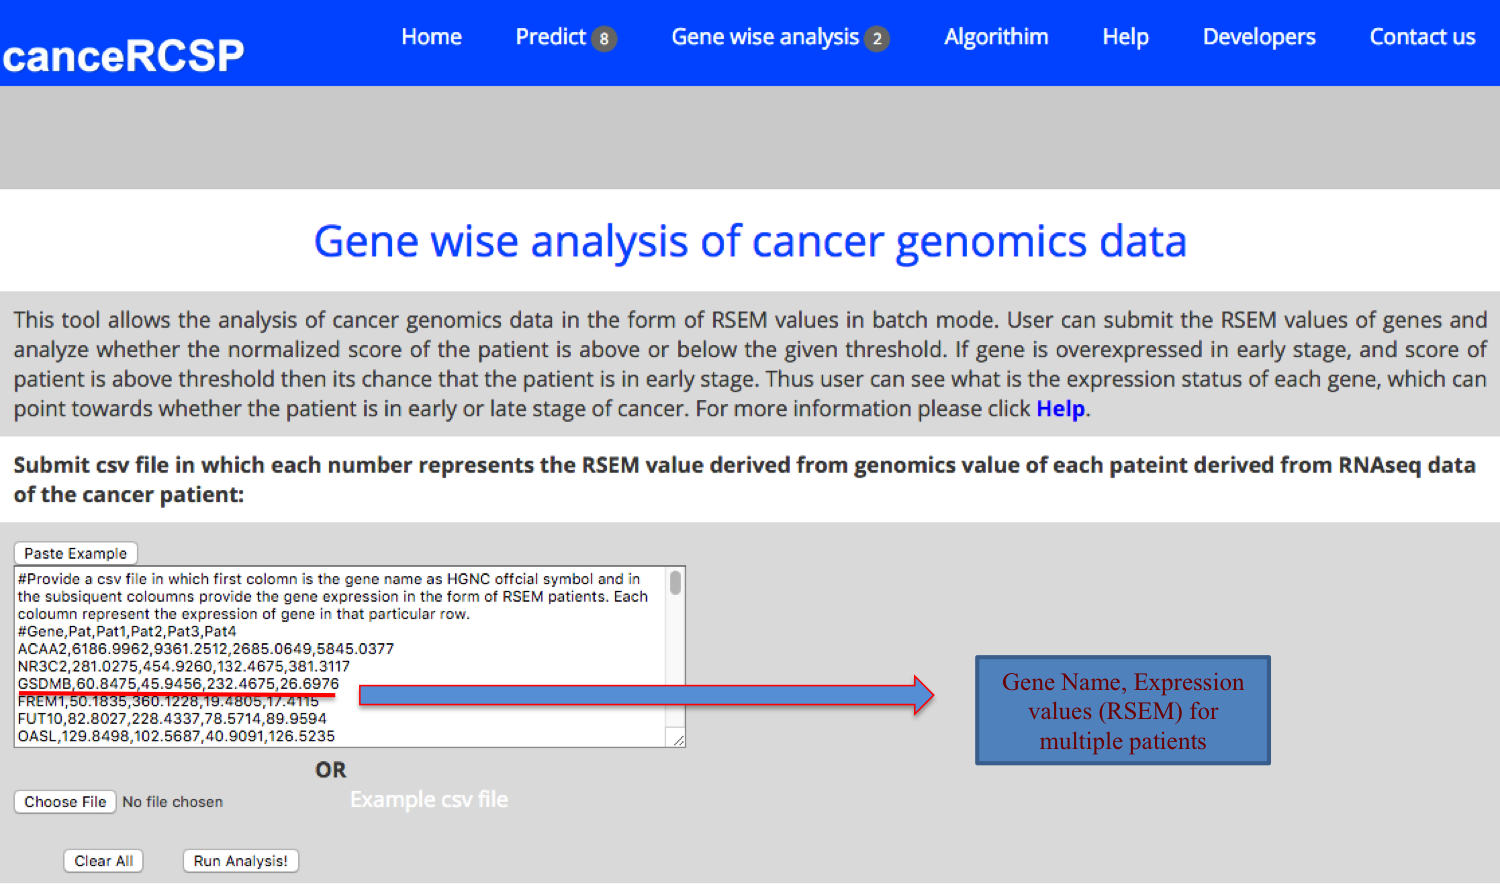
| This module allows the analysis of cancer genomics data in the form of RSEM values in batch mode. User can submit the RSEM values of genes from multiple patients and analyze whether the normalized score of the patient is above or below the given threshold. If gene is overexpressed in early stage, and score of patient is above threshold then its chance that the patient is in early stage. Thus user can see what is the expression status of each gene, which can point towards whether the patient is in early or late stage of cancer. |
| |
 |
The result Page shows like the following. The result page gives the mass and C.E time of the peptides given by the user. It provides the number of cancer samples and healthy samples in the database for each peptide with particular mass and C.E time. Along with this information mean intensity in cancerous and healthy samples are also provided. The most important feature of this analysis is that it provides the probability of particular peptide to act as cancer biomarker along with the graphical represntation. This analysis also provides the average probability of a sample to be cancerous or healthy. |
 |
| |