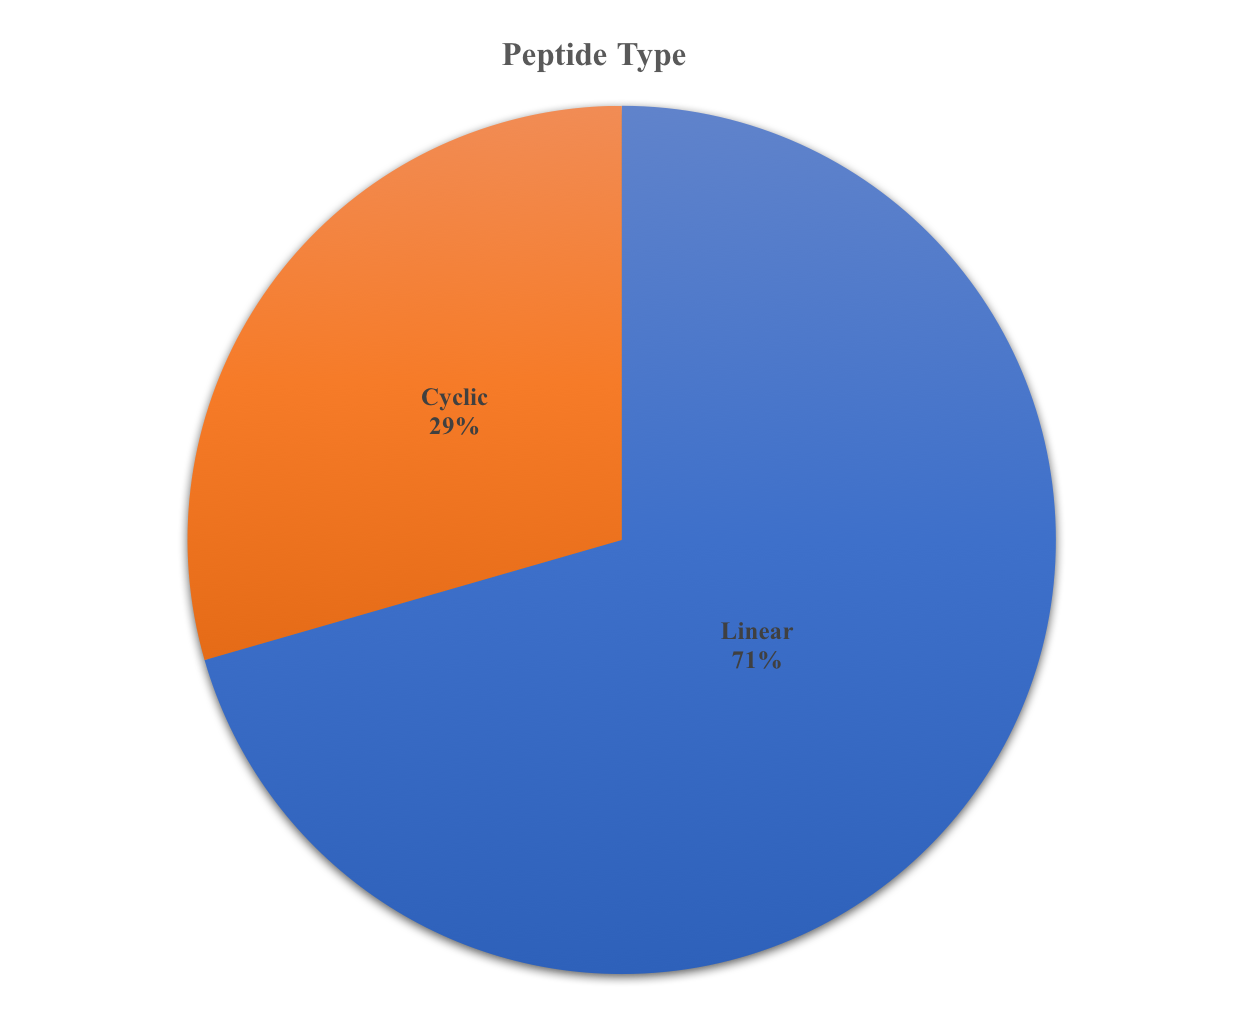
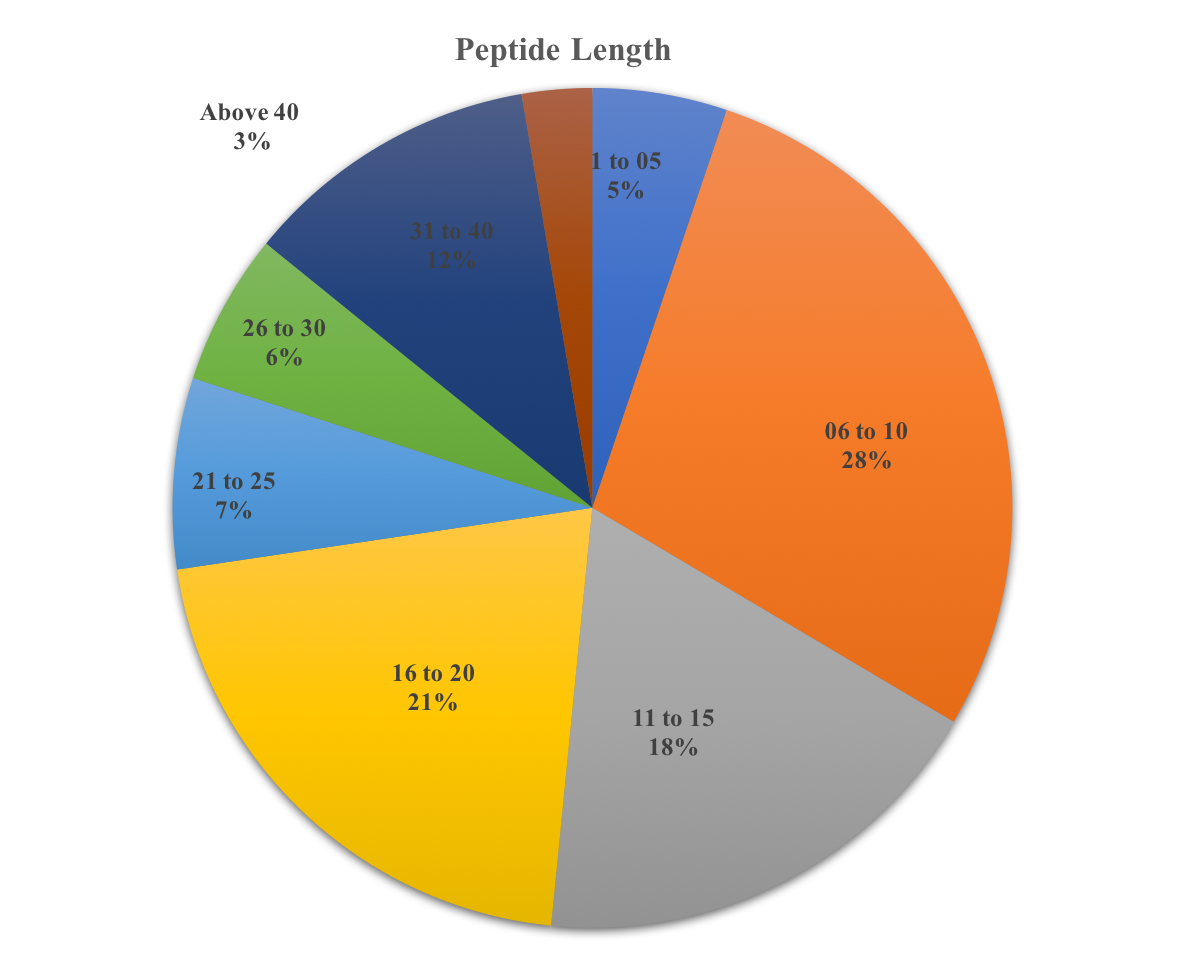
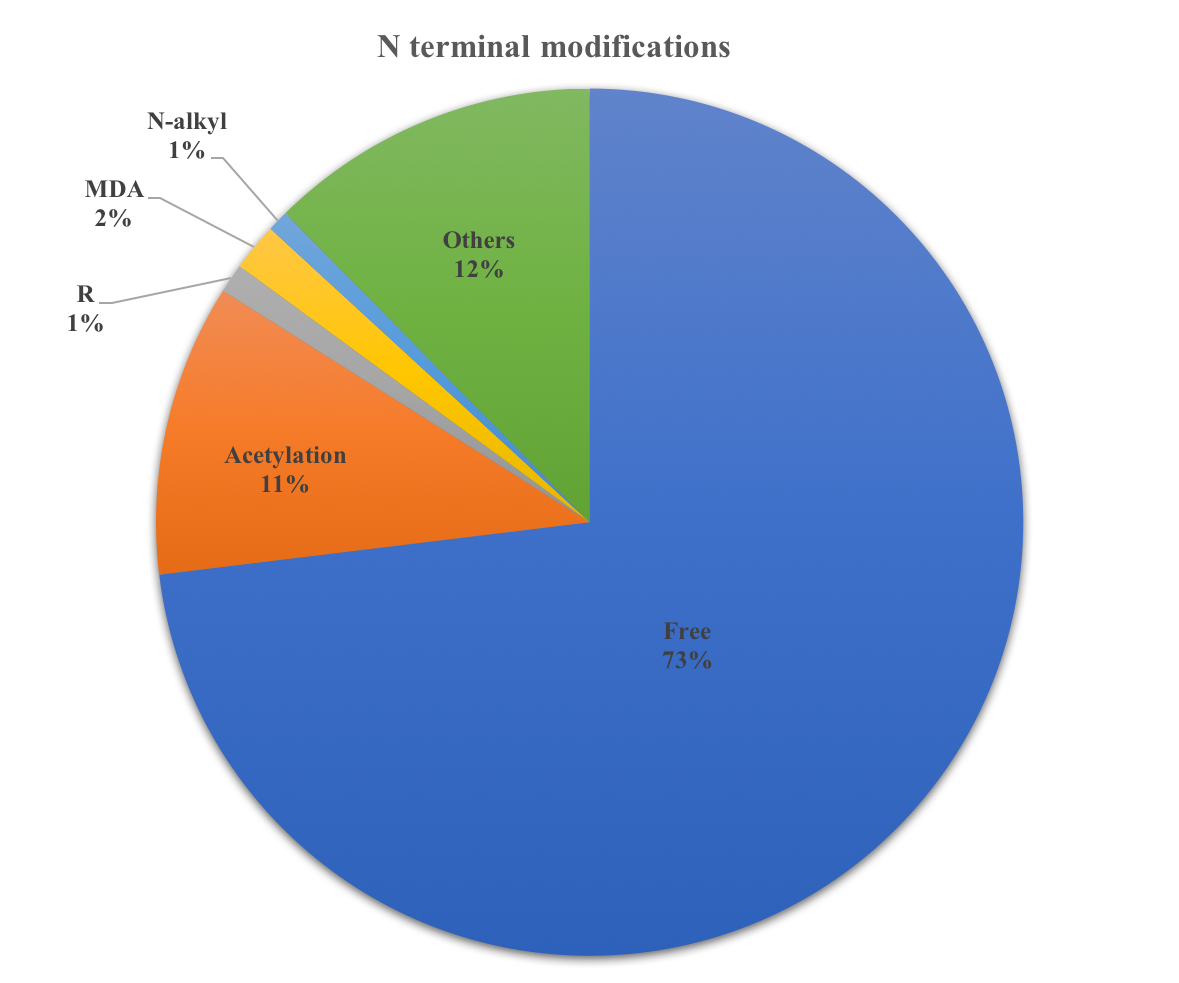
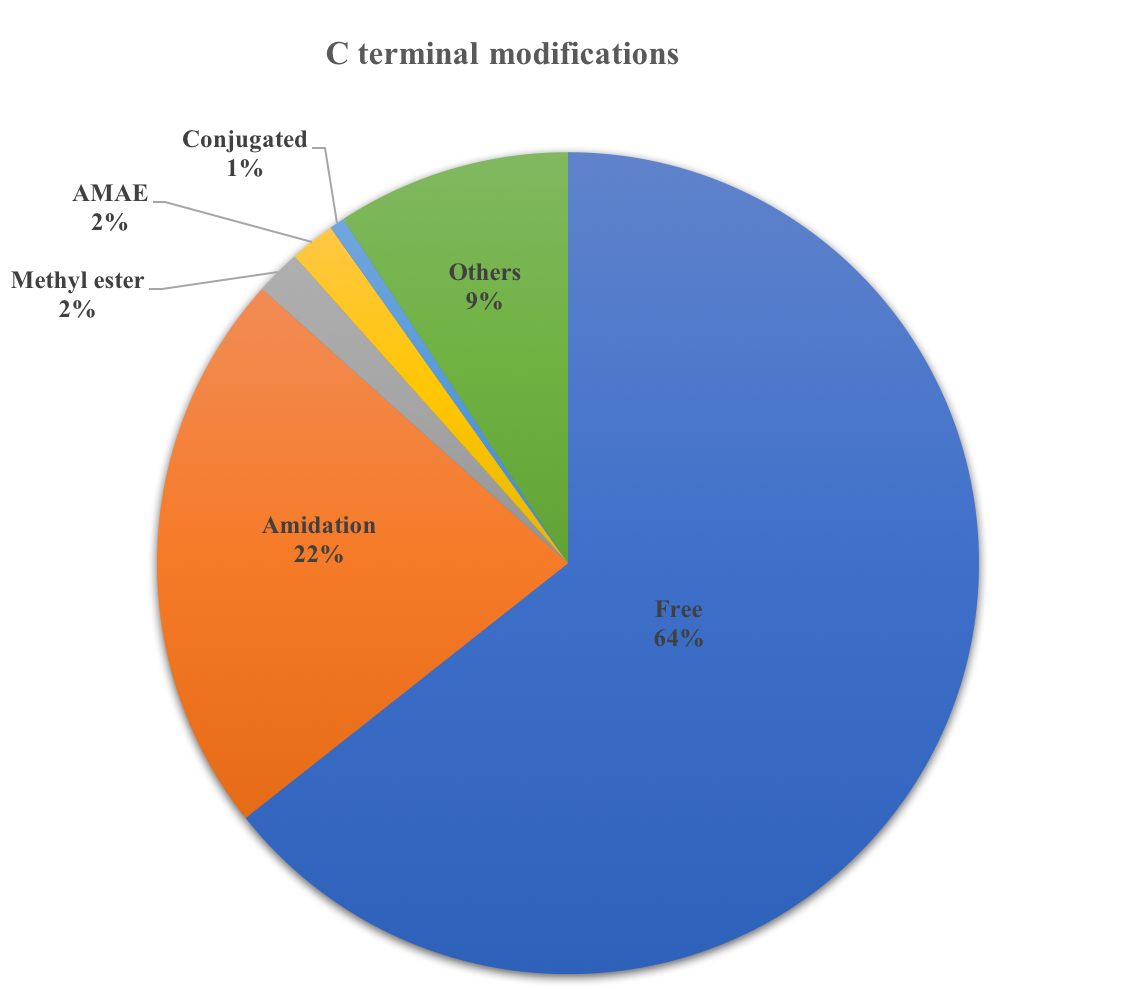
Figure 1: Represent the percentage distribution of Anti-tubercular peptides Source in AntiTbPdb.Figure 2: Represent the percentage distribution of Anti-tubercular peptide types in AntiTbPdb.Figure 3: Represent the percentage distribution of Anti-tubercular peptides Length in AntiTbPdb.Figure 4: Represent the percentage distribution of Anti-tubercular peptides Chirality in AntiTbPdb.Figure 5: Represent the percentage distribution of Anti-tubercular peptides N-terminal Modifications in AntiTbPdb.Figure 6: Represent the percentage distribution of Anti-tubercular peptides C-terminal Modifications in AntiTbPdb.Figure 7: Represent the percentage distribution of Anti-tubercular peptides Chemical Modifications in AntiTbPdb.Figure 8: Represent the percentage distribution of Anti-tubercular peptides Mycobacterial Species in AntiTbPdb.