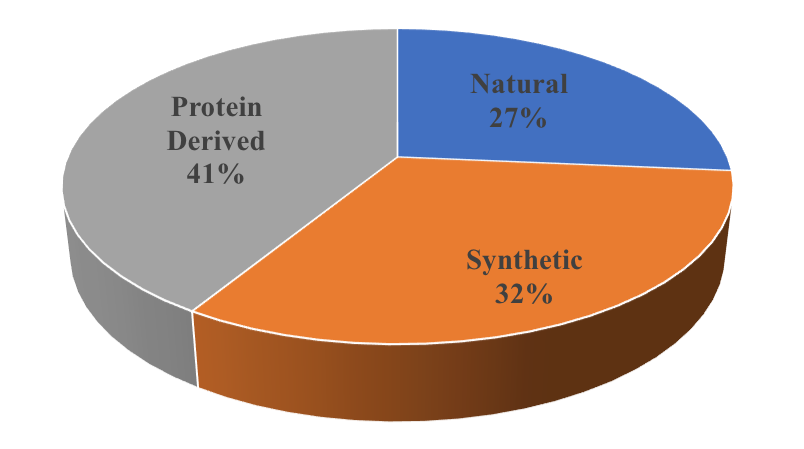
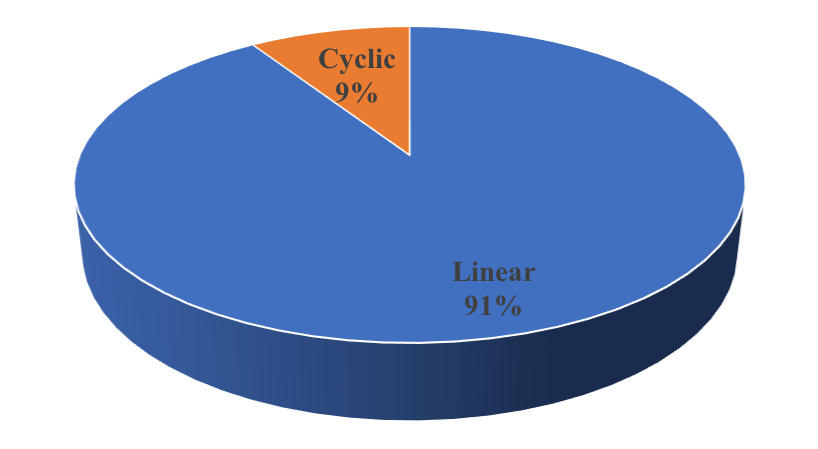
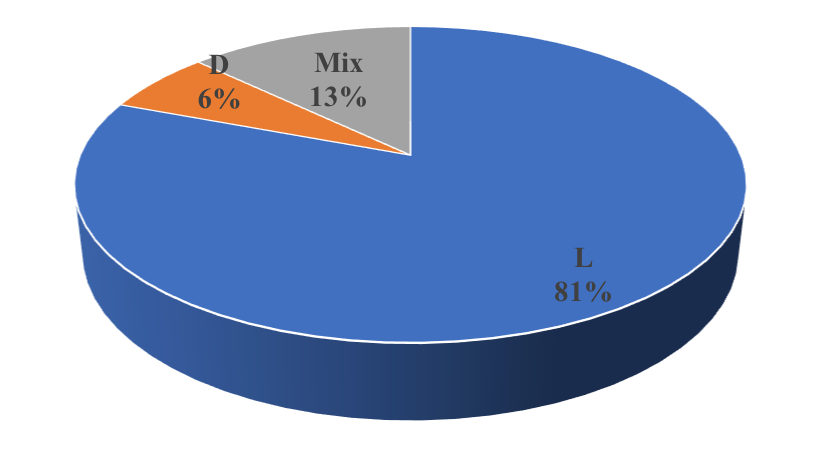
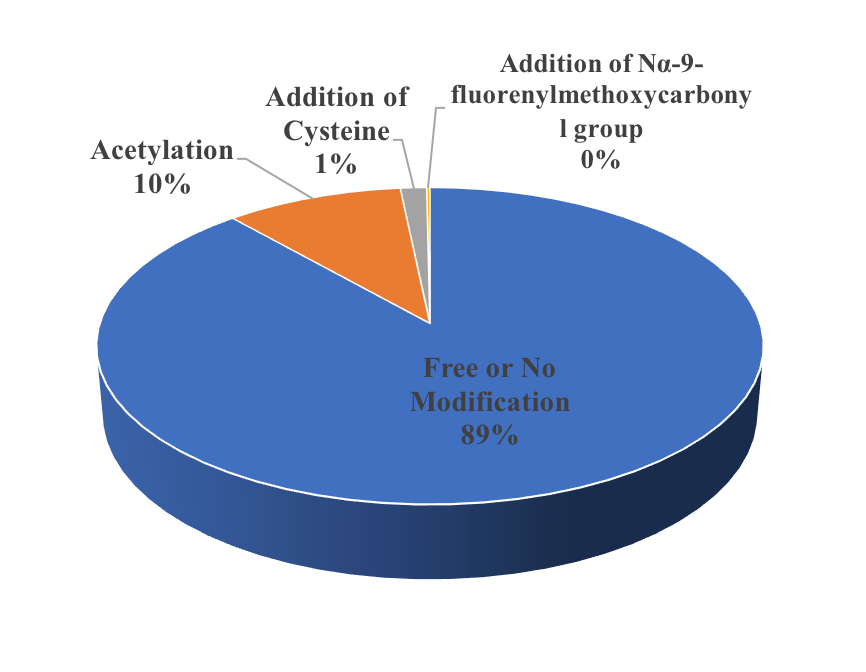
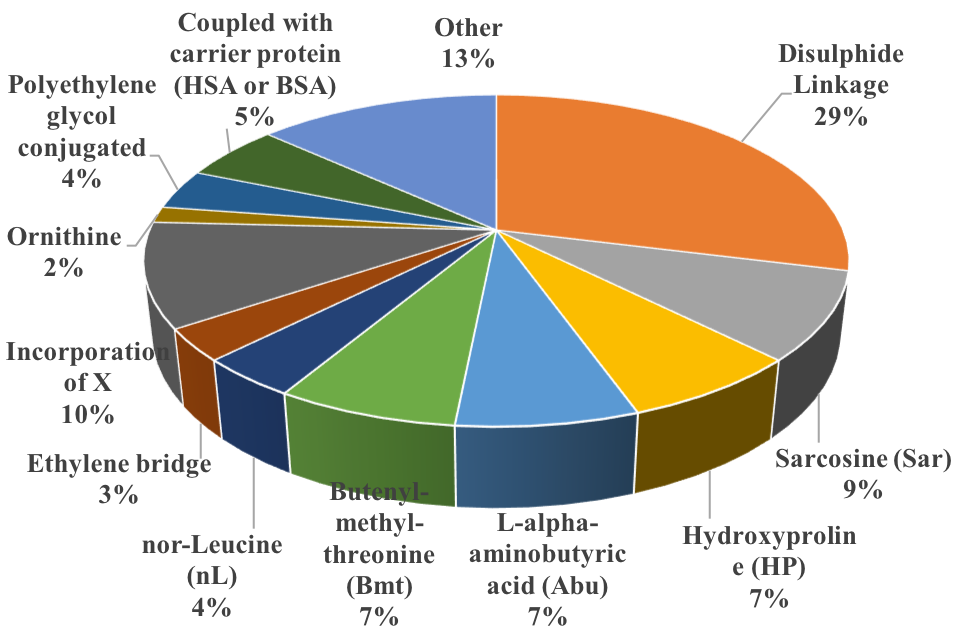
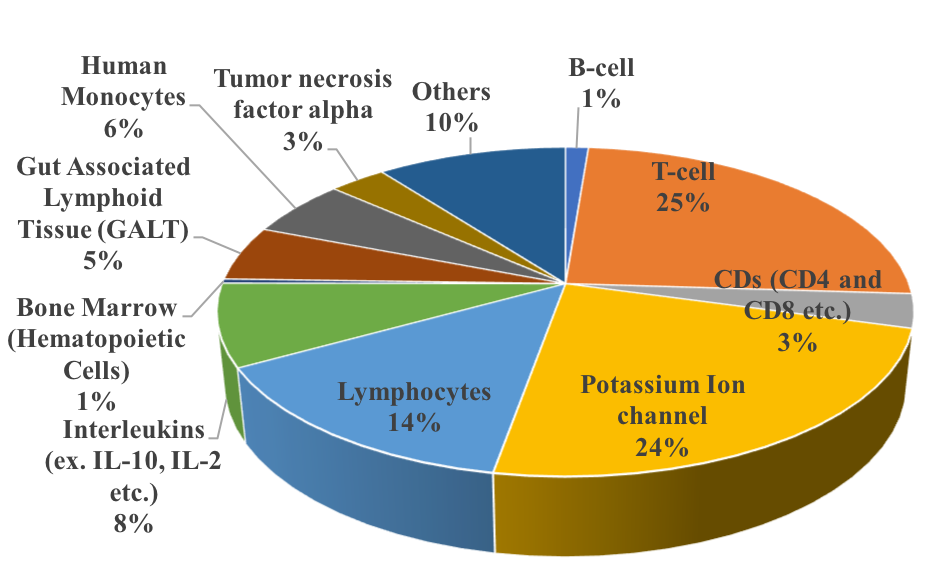
Figure 1: Represent the percentage distribution of Immunosuppressive peptides Source/ Nature in ImmunoSPdb.Figure 2: Represent the percentage distribution of Immunosuppressive peptide types in ImmunoSPdb.Figure 3: Represent the percentage distribution of Immunosuppressive peptides Length in ImmunoSPdb.Figure 4: Represent the percentage distribution of Immunosuppressive peptides Chirality in ImmunoSPdb.Figure 5: Represent the percentage distribution of Immunosuppressive peptides N-terminal Modifications in ImmunoSPdb.Figure 6: Represent the percentage distribution of Immunosuppressive peptides C-terminal Modifications in ImmunoSPdb. Figure 7: Represent the percentage distribution of Immunosuppressive peptides Chemical Modifications in ImmunoSPdb. Figure 8: Represent the percentage distribution of effective targets for Immunosuppressive peptides.