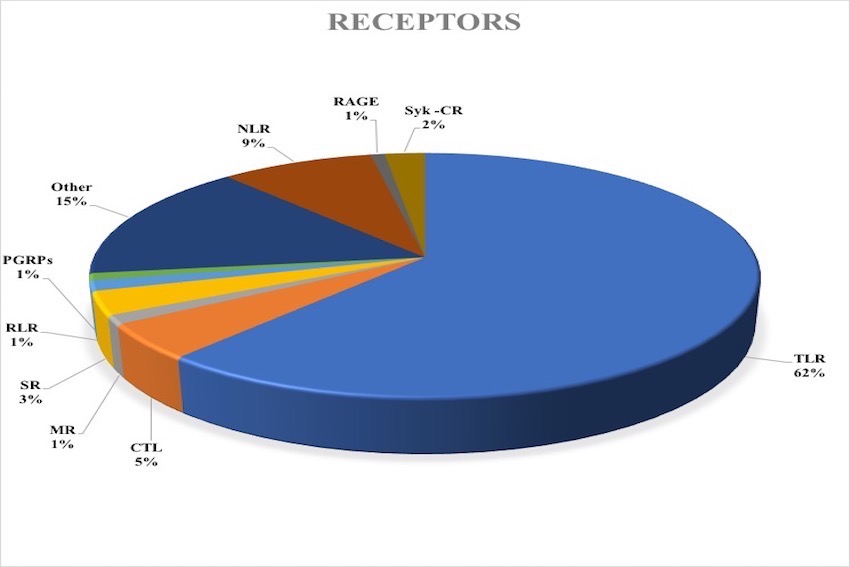
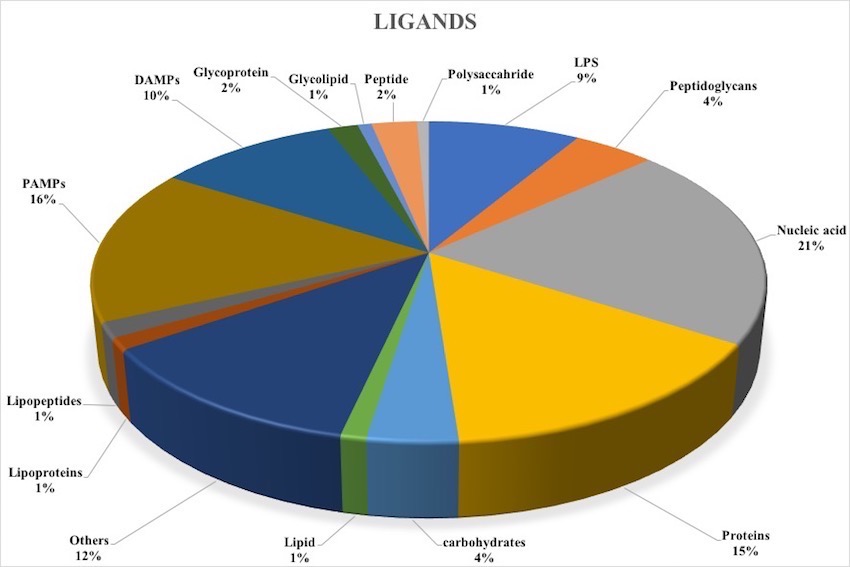
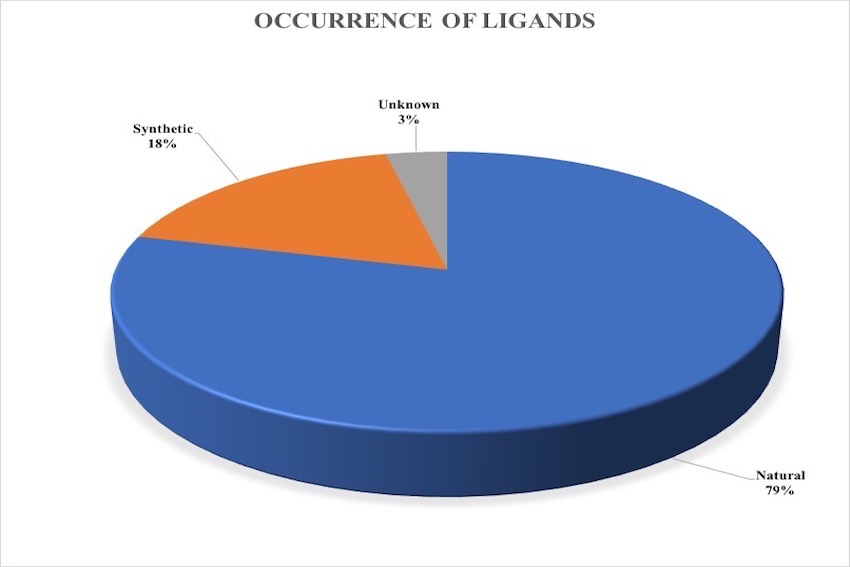
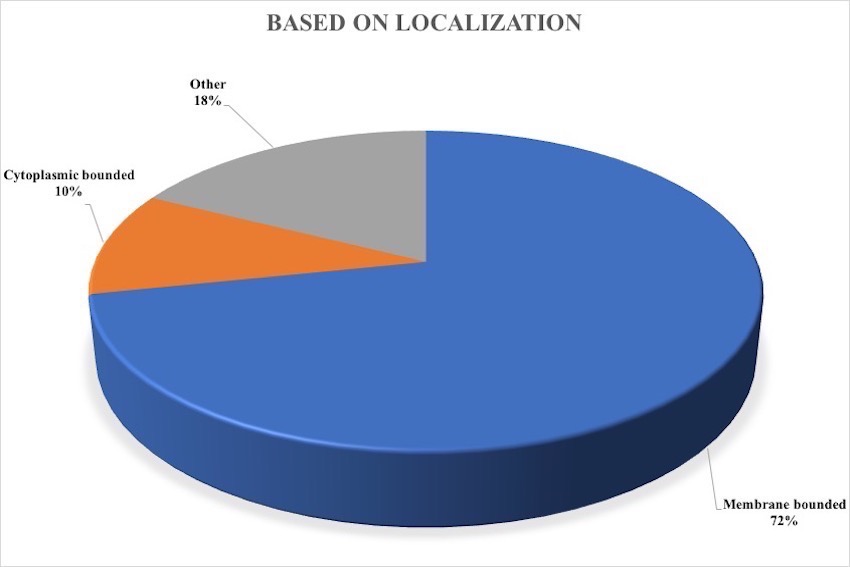
Figure 1: Represent the percentage distribution of Pattern recognition Receptors in PRRDB 2.0.Figure 2: Represent the percentage distribution of Ligands in PRRDB 2.0.Figure 3: Represent the percentage distribution of occurence of ligands in PRRDB2.0.Figure 4: Represent the percentage distribution of PRRs based on localization.