|
PREDICTION |
|
| Predict Biomarker From MASS and CE Time |
|
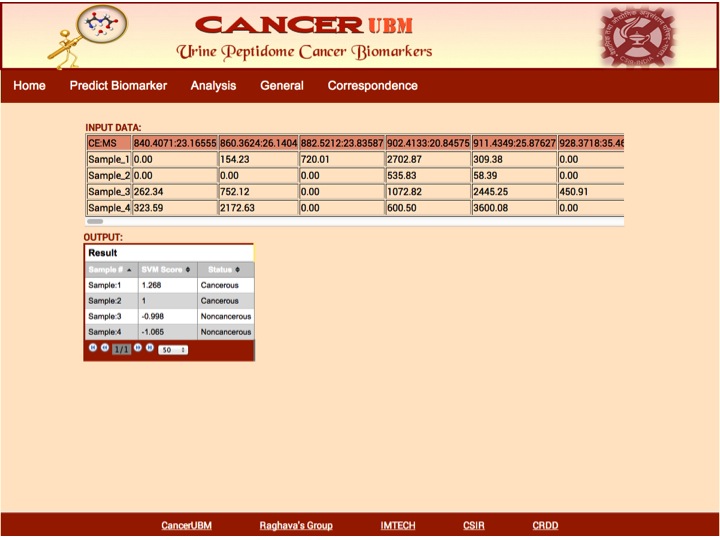
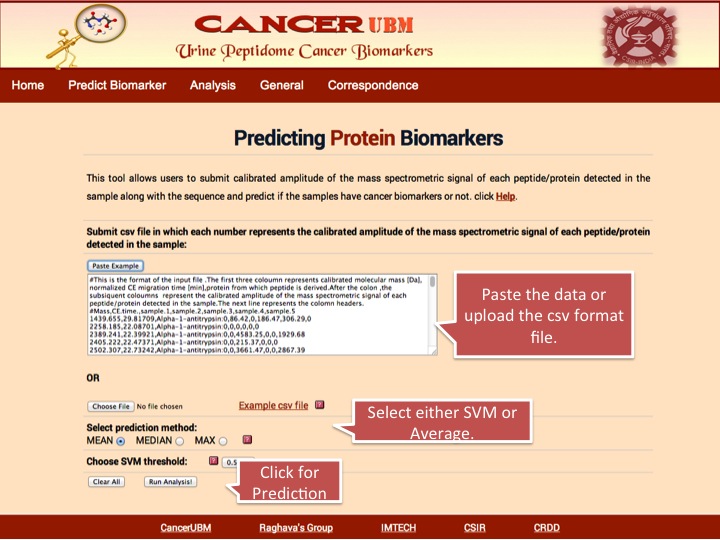
Here user will submit the peptides which will be characterized by the Mass in Daltons and C.E Time in min. User has to submit the calibrated amplitude of the mass spectrometric signal of each peptide/protein detected in each sample. Cancerubm will select the 173 biomarkers peptides from the given list of the user to do svm analysis. If the experiment does not provide all the 173 peptides, which is required for the prediction of the cancer status of the sample, then Average analysis can be done.
The format of the file is shown in sample example .The first column should be of mass and next column of CE time separated by comma. Then data of each patient should be given in column against its respective peptide. Data of different samples should be separated by comma. After first two columns of peptide Mass and C.E time, the data should be separated by ”:”.
|
|
 |
The result Page shows like the following. The result Page gives the input data which is provide by the user and the output which predicts if a sample is cancerous or healthy along with the svm score. |
 |
|
|
|
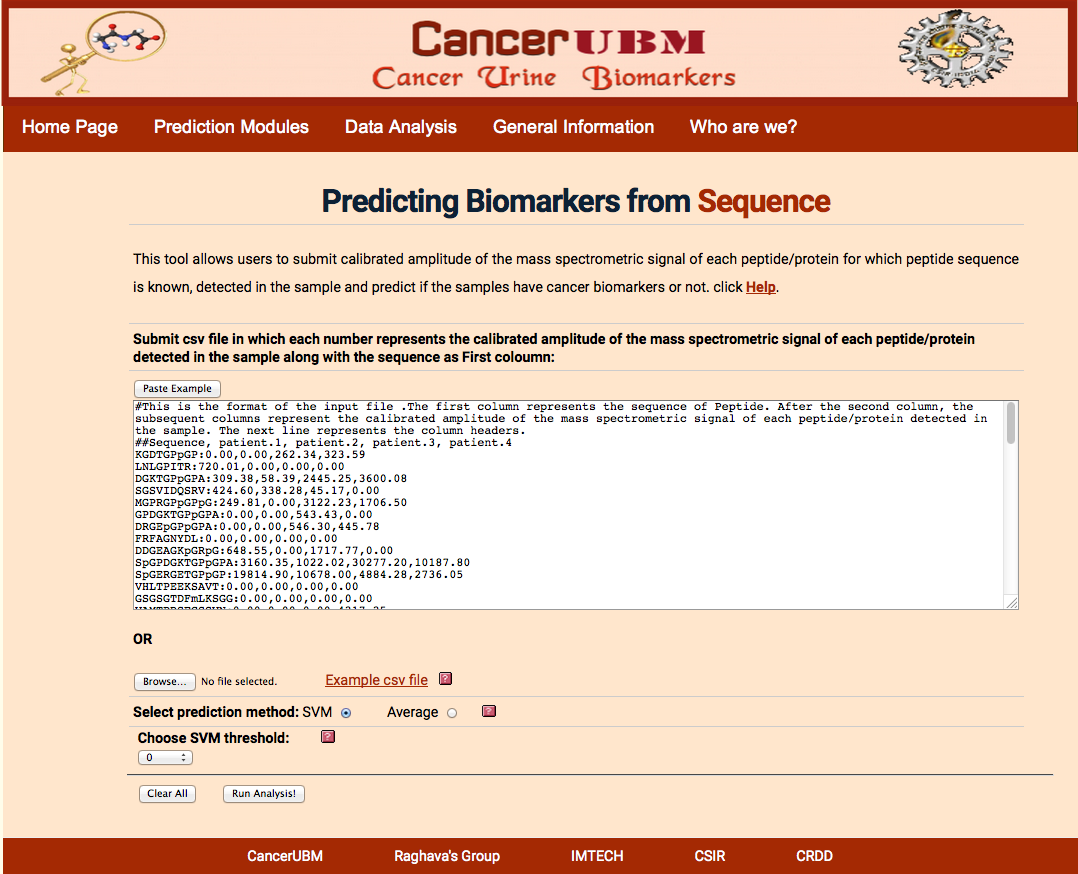
| Precting Biomarkers with Sequence Information |
|
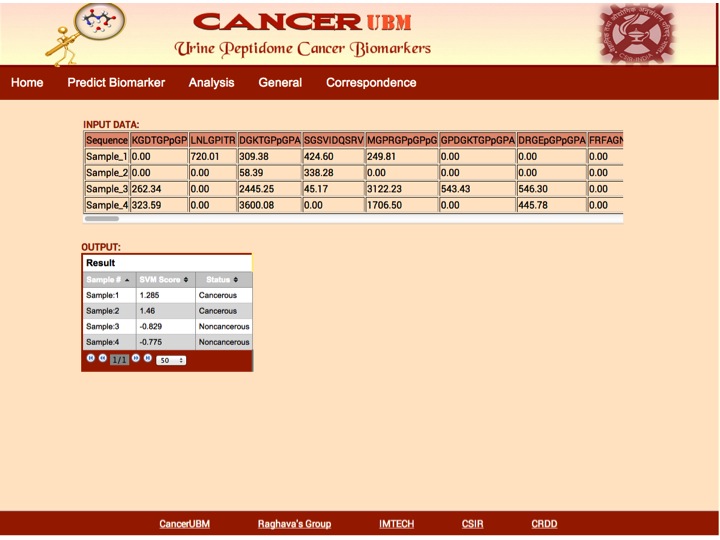
Here user will submit the peptides, which will be characterized by the Mass in Daltons and C.E Time in min and sequence. User has to submit the calibrated amplitude of the mass spectrometric signal of each peptide/protein detected in each sample. Cancerubm will select the 61 biomarkers peptides(derived from the panel of 173 peptides for which sequence information was available) from the given list of the user to do svm analysis. Here the "p" donates hydroxyproloine. If the experiment does not provide all the 61 peptides that is required for the prediction of the cancer status of the sample, then Average analysis can be done.
The format of the file is shown in sample example .The first coloumn should be of mass and next column of CE time separated by comma. Then data of each patient should be given in column against its respective peptide. Data of different samples should be separated by comma. After first two columns of peptide mass and C.E time, the data should be separated by ”:”.
|
|
 |
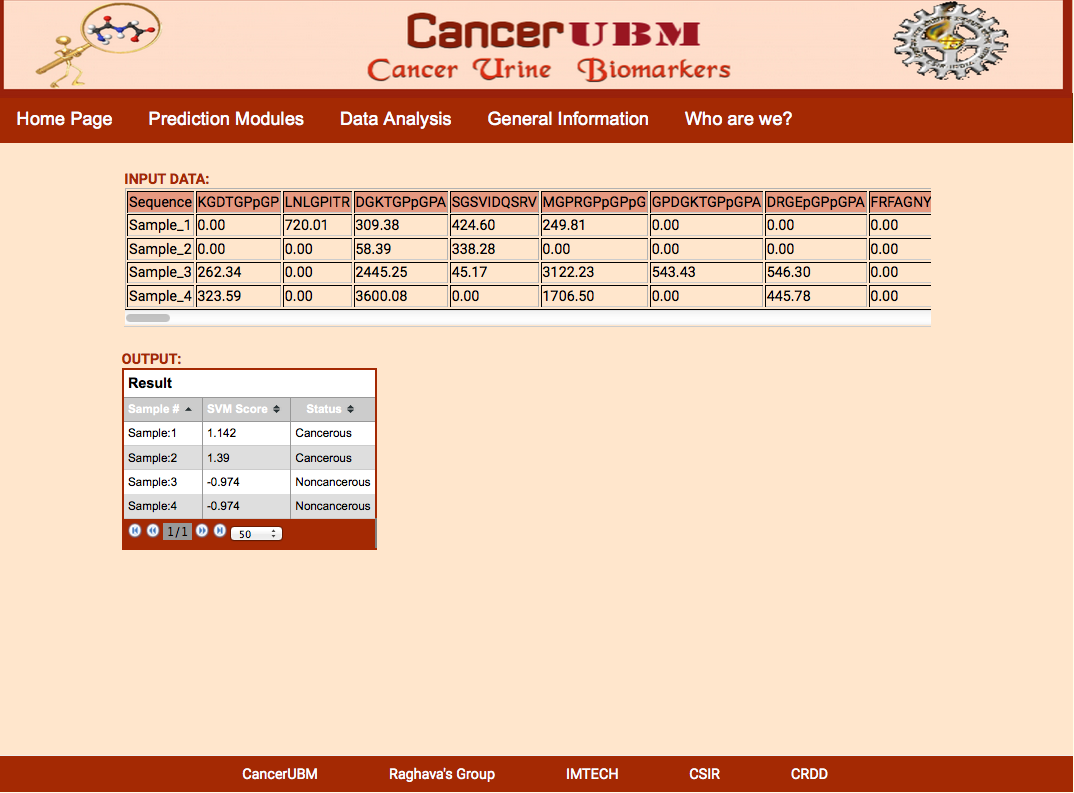
The result Page shows like the following.The result Page gives the input data which is provide by the user and the output which predicts if a sample is cancerous or healthy along with the svm score. |
 |
|
|
|
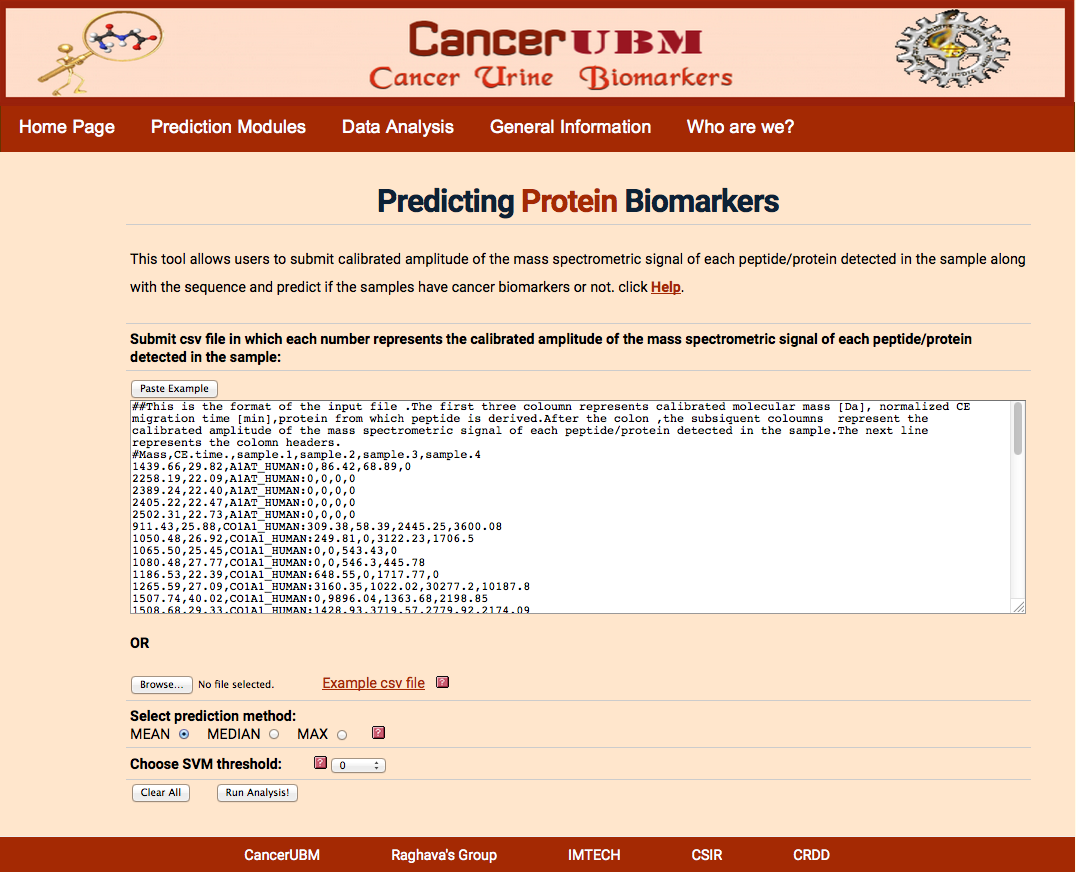
| Protein Level Biomarker Identification |
|
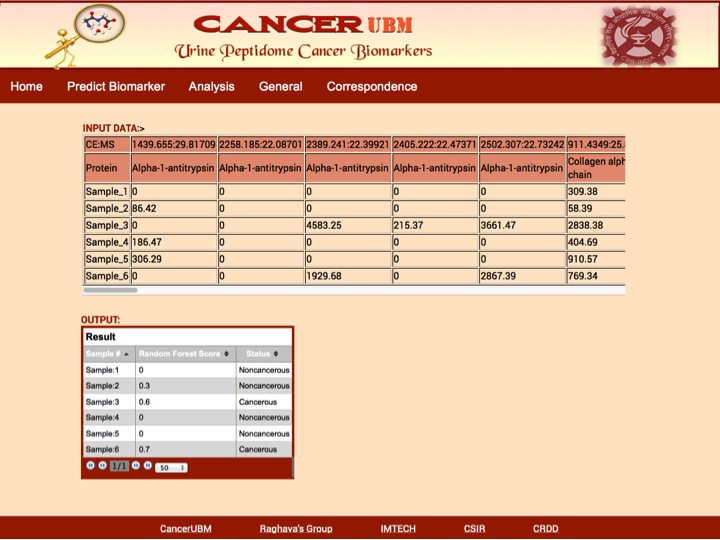
Here user will submit the peptides which will be characterized by the Mass in Daltons and C.E Time in min and protein to which that peptide belong. User has to submit the calibrated amplitude of the mass spectrometric signal of each peptide/protein detected in each sample. Cancerubm will select the 50 peptides (derived from the panel of 61 peptides for which there are more than two peptides for each protein) from the given list of the user to do svm analysis. If the experiment does not provide all the 61 peptides that are required for the prediction of the cancer status of the sample, then Average analysis can be done.
The format of the file is shown in sample example .The first column should be of mass and next column of CE time separated by comma. Then data of each patient should be given in column against its respective peptide. Data of different samples should be separated by comma. After first two columns of peptide mass and C.E time, the data should be separated by “:”.
|
|
 |
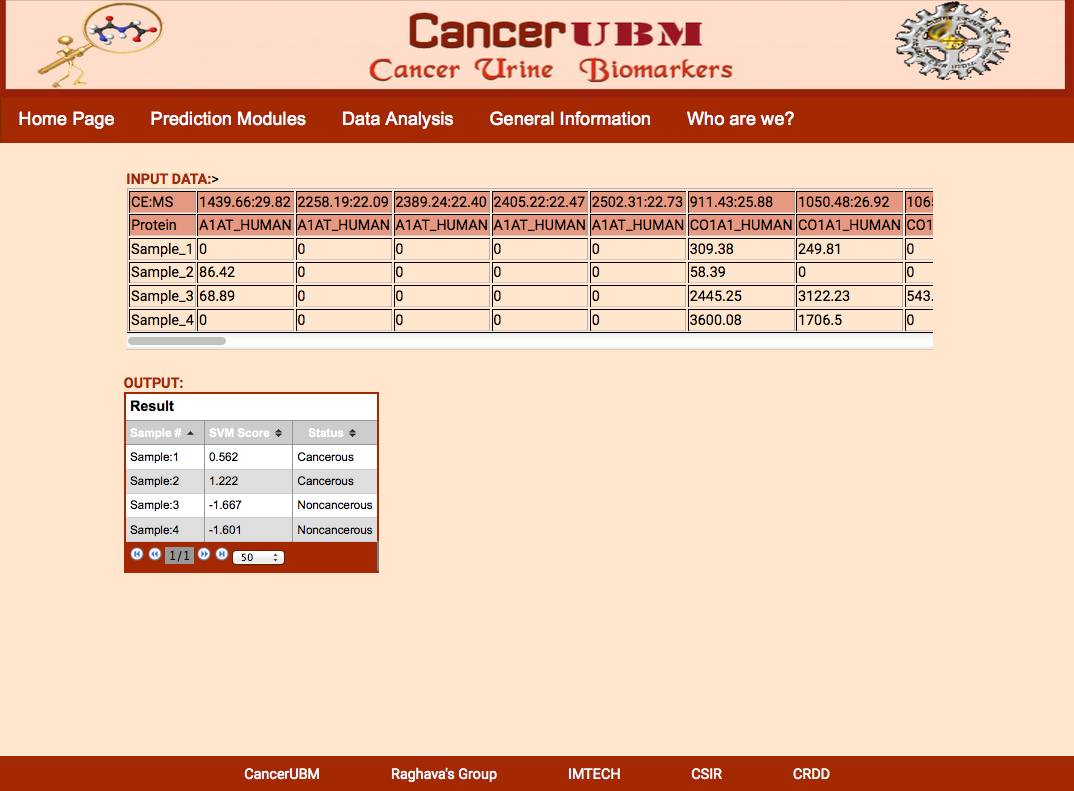
The result Page shows like the following.The result Page gives the input data which is provide by the user and the output which predicts if a sample is cancerous or healthy along with the svm score. |
 |
|
|
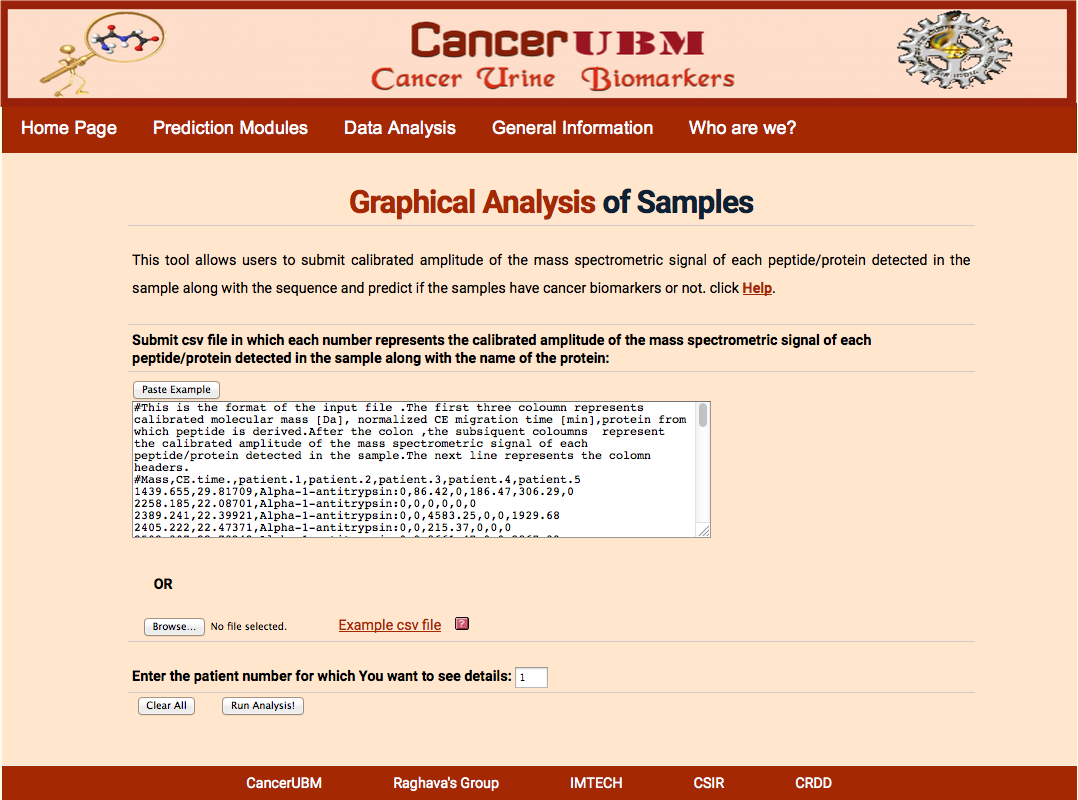
| Graphical Protein Analysis |
|
Here user will submit the peptides that will be characterized by the Mass in Daltons and C.E Time in min and sequence. User has to submit the calibrated amplitude of the mass spectrometric signal of each peptide/protein detected in each sample. Here user intensities will be compared to the cancerous and healthy samples present in the database. Sample wise user intensities are compared to mean of average intensities of mean, median and max intensities of all the peptides of a particular protein is compared.
|
 |
The result Page shows like the following.The result Page gives the input data which is provide by the user and the output which predicts if a sample is cancerous or healthy along with the svm score. |
 |
|
|
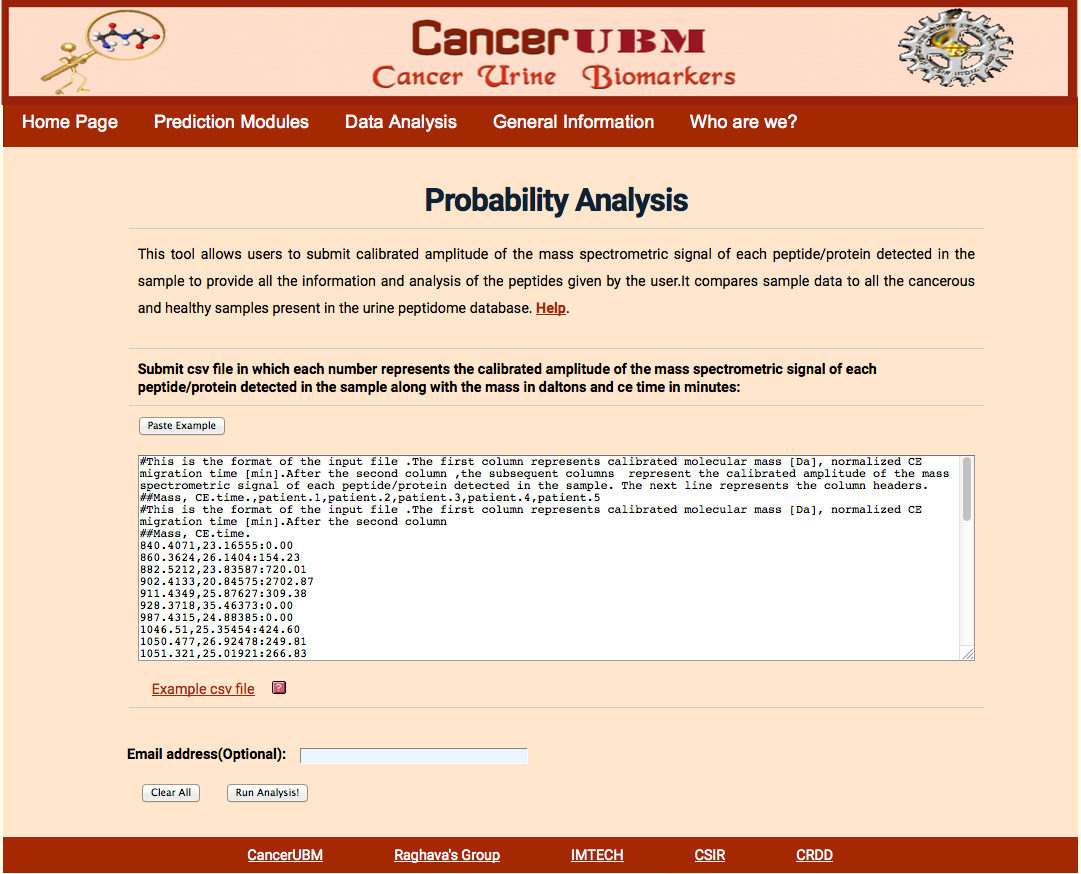
| Graphical Probability Analysis |
|
Here user will submit the peptides that will be characterized by the Mass in Daltons and C.E Time in min and sequence. User has to submit the calibrated amplitude of the mass spectrometric signal of each peptide/protein detected in each sample. Here the probability of each peptide to act as biomarker and probability of each sample to be cancerous and healthy is calculated.
|
|
 |
The result Page shows like the following. The result page gives the mass and C.E time of the peptides given by the user. It provides the number of cancer samples and healthy samples in the database for each peptide with particular mass and C.E time. Along with this information mean intensity in cancerous and healthy samples are also provided. The most important feature of this analysis is that it provides the probability of particular peptide to act as cancer biomarker along with the graphical represntation. This analysis also provides the average probability of a sample to be cancerous or healthy. |
 |
|