Help Section
This page provides help to the users to make them comfortable with the use of the webservices for predicting and designing Beta-turns.
More »
Beta Turn in proteins
Beta-turns are the most common type of non-repetitive structures, and constitute on average 25% of the residues in all protein chains. In a beta turn, a tight loop is formed when the carbonyl oxygen of one residue forms a hydrogen bond with the amide proton of an amino acid three residues down the chain. This hydrogen bond stabilizes the beta bend structure. A beta turn can reverse the direction of its peptide chain.
Prediction of Beta Turn
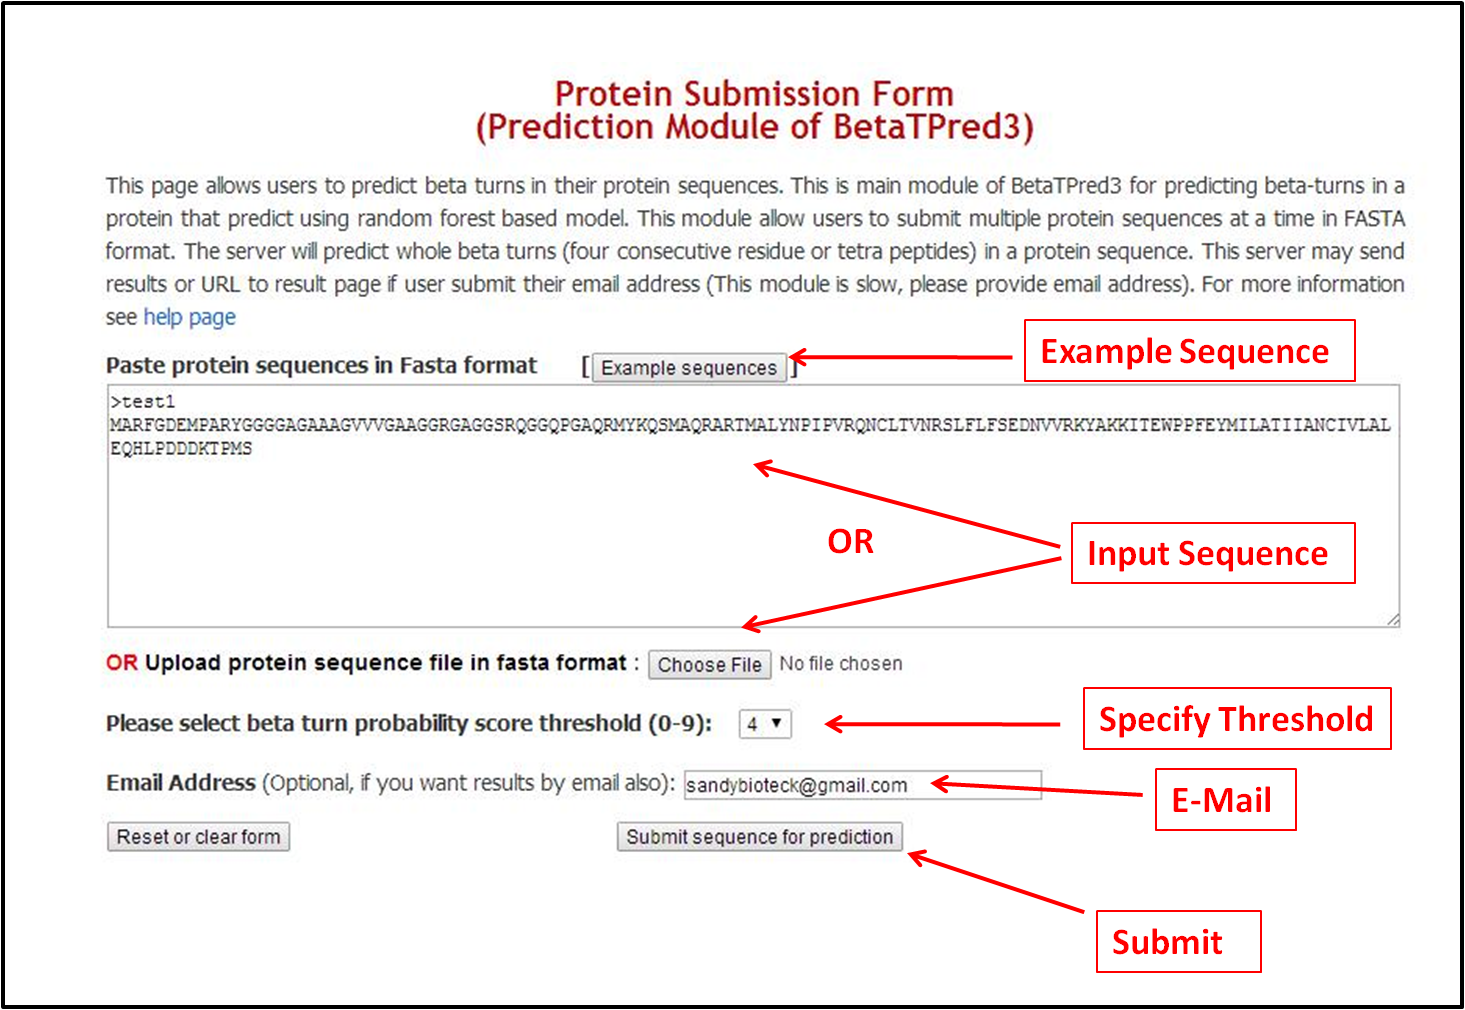
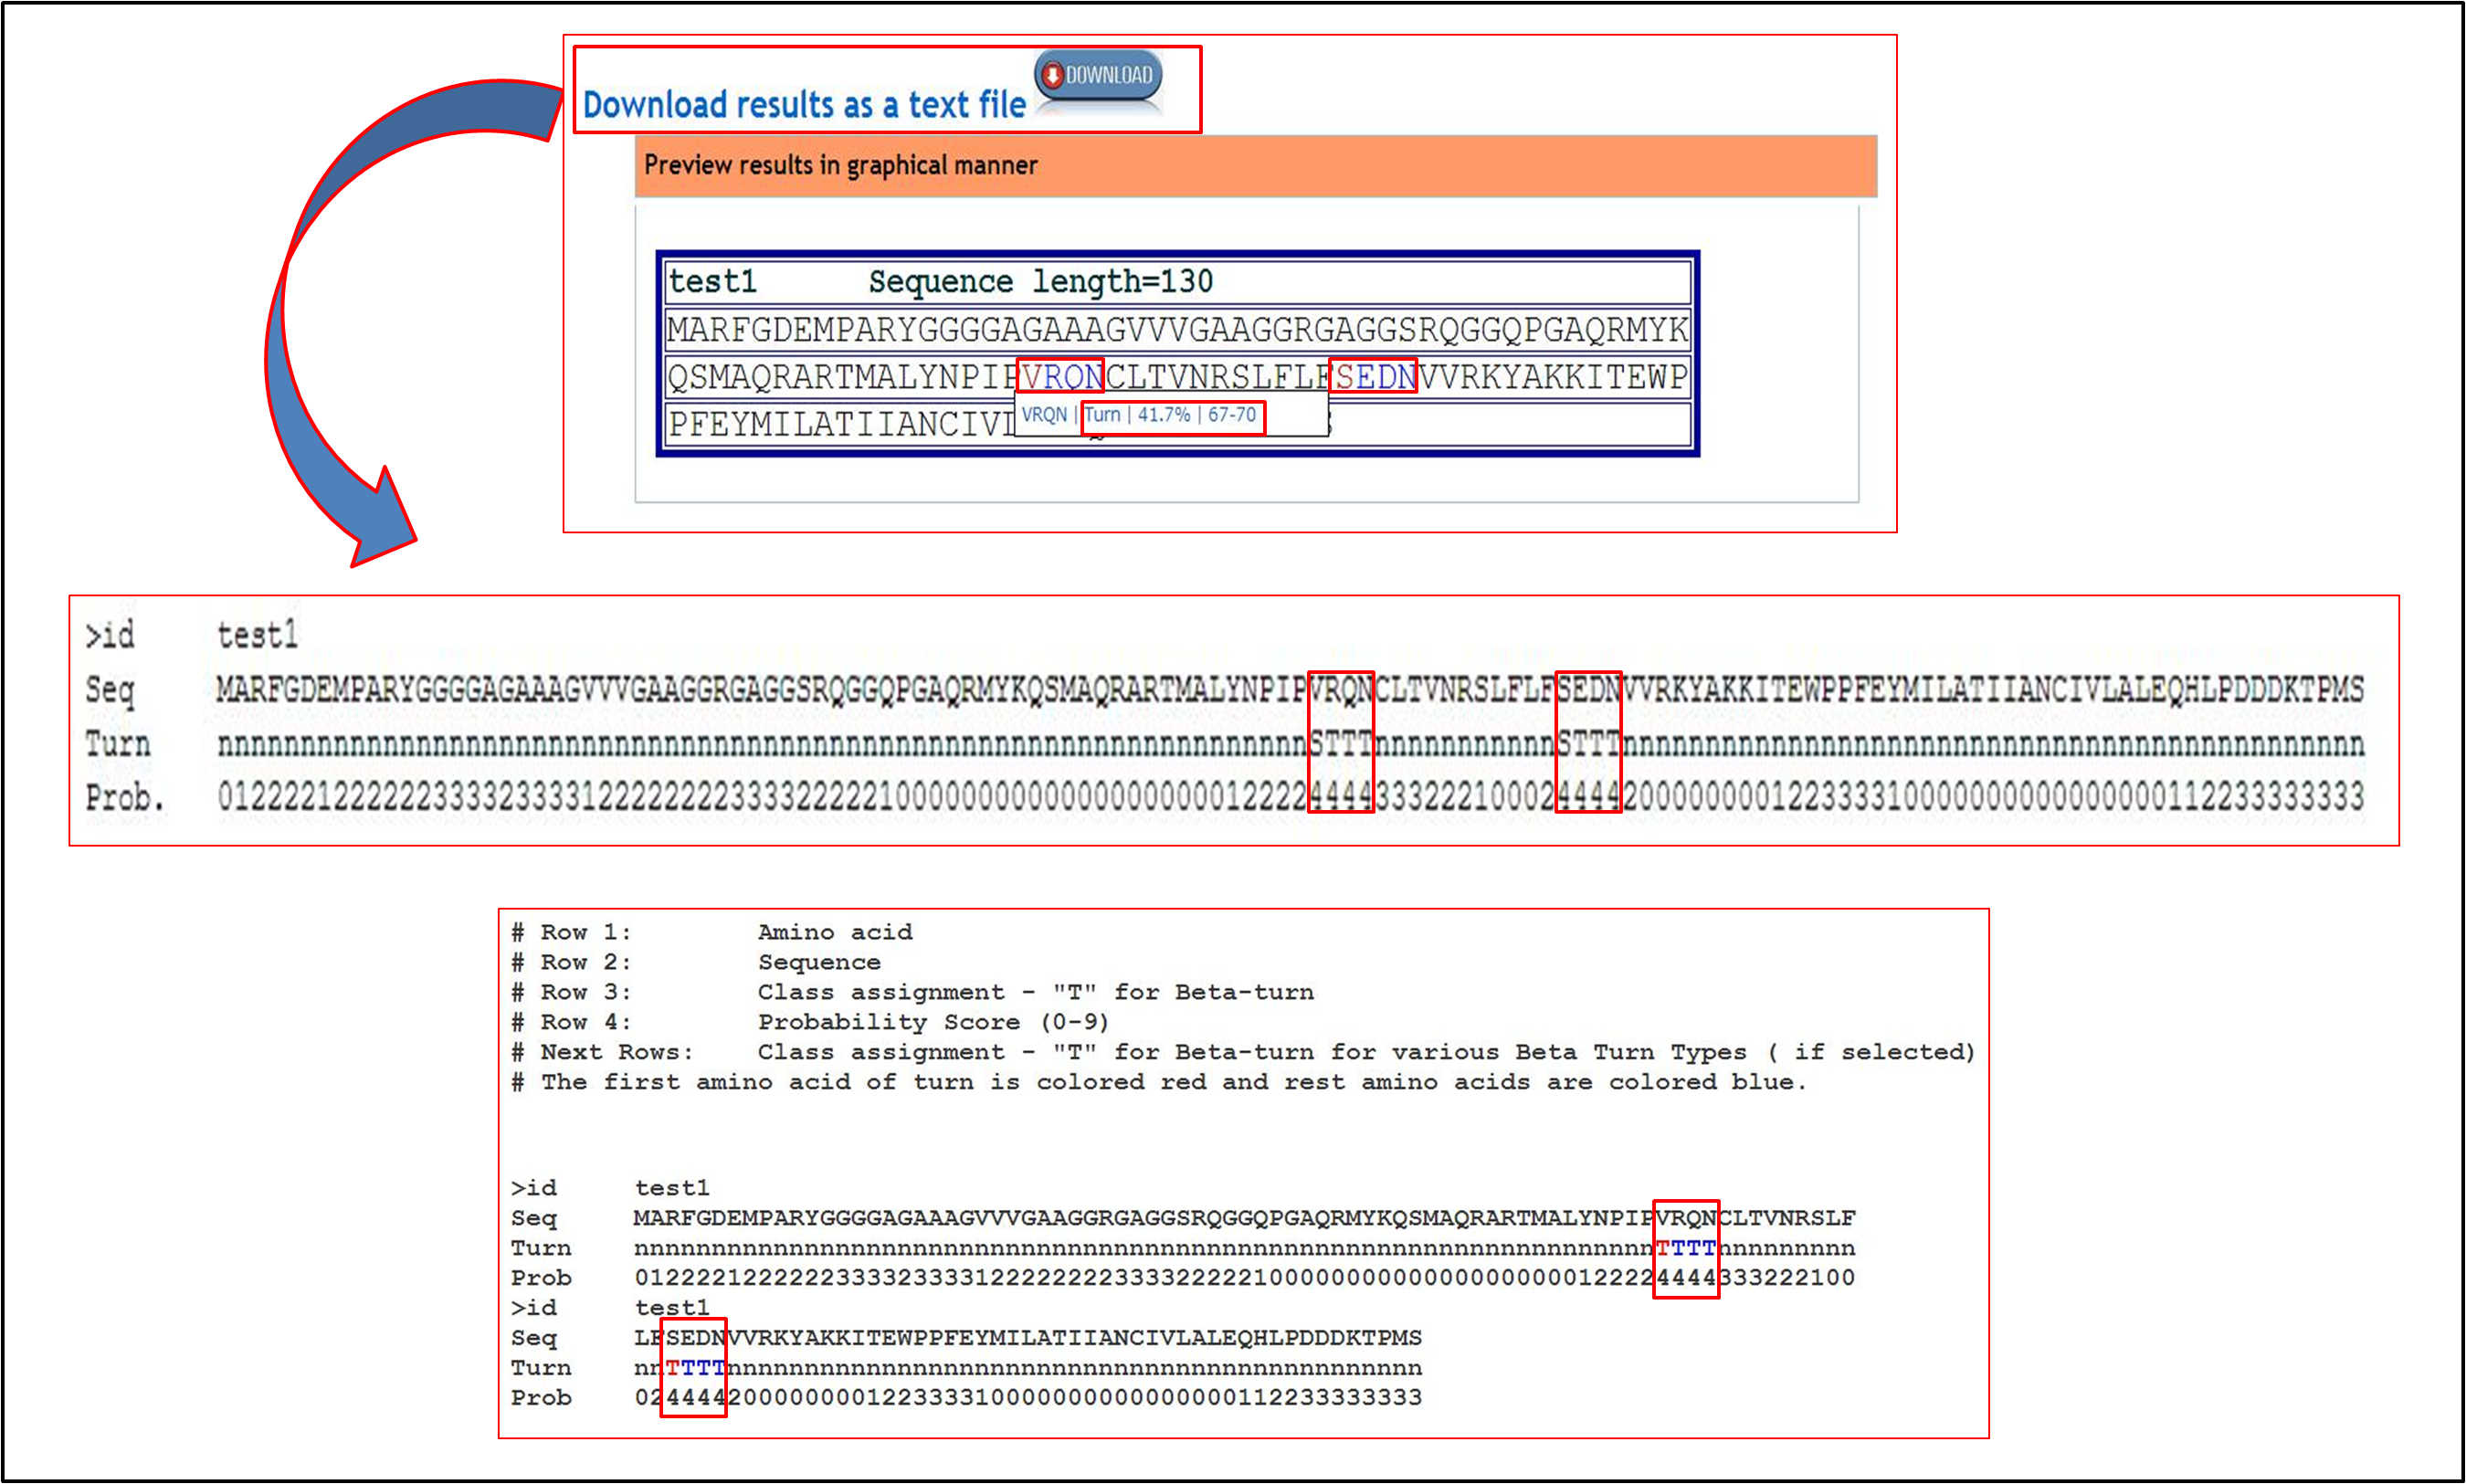
In the past numerous methods were developed to predict the beta turns. But all of this method were trained to predict residue level prediction instead of four residue level. Since, a beta turn is composed of four consecutive amno acids. Using this simple approach we have achieved good prediction accuracy and realistic prediction of beta turns. To predict beta turns in your protein click »Submit »
Propensity based Beta Turn prediction
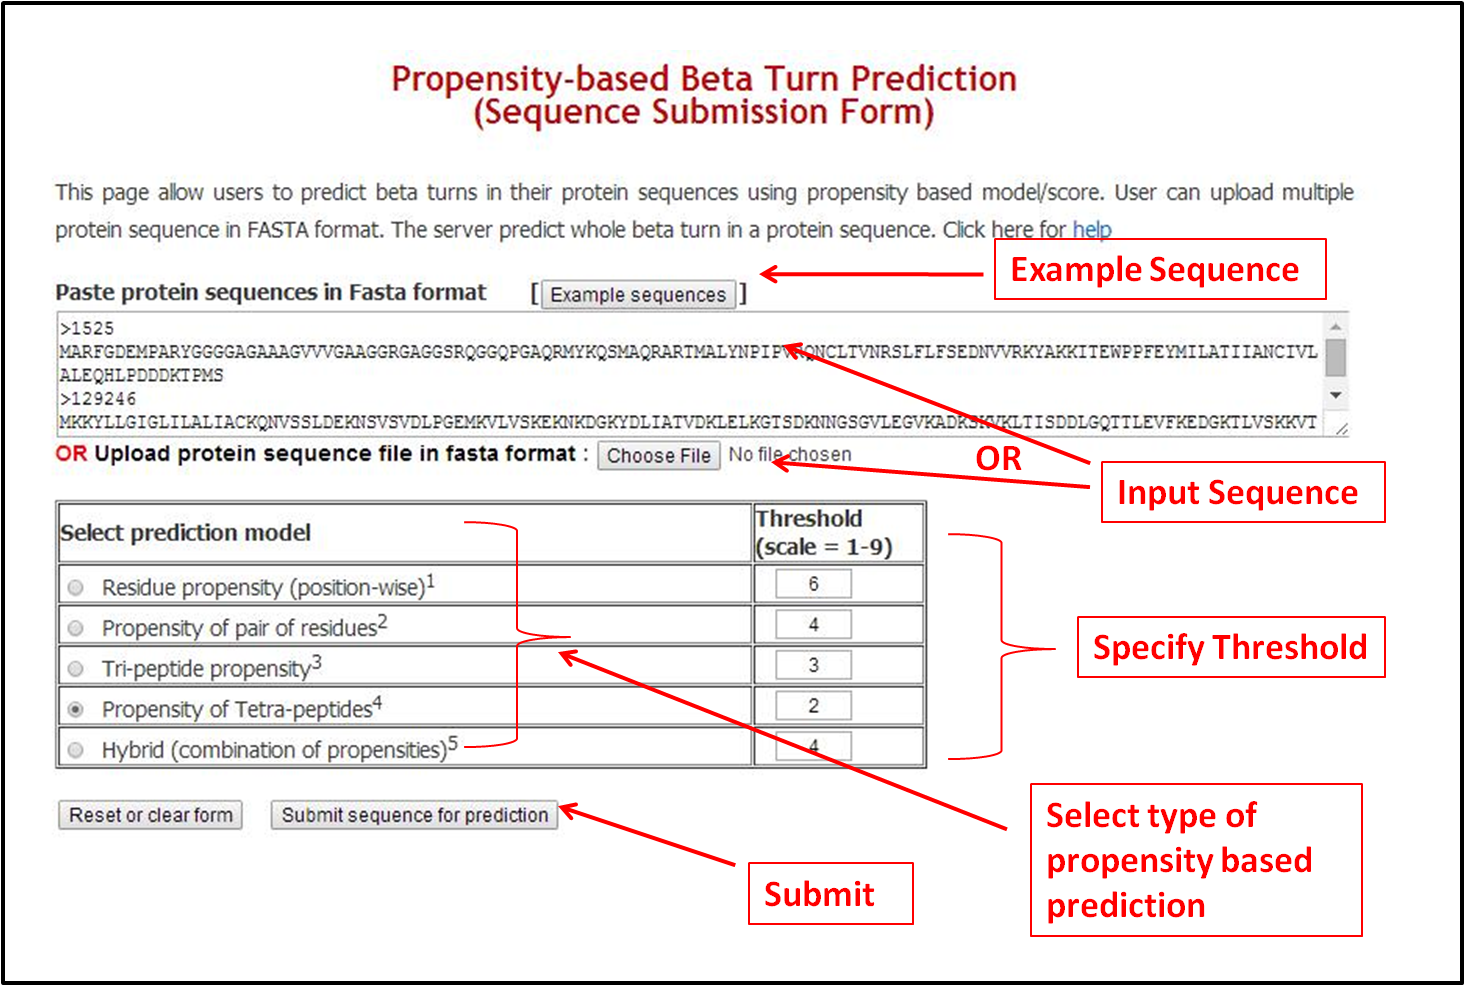
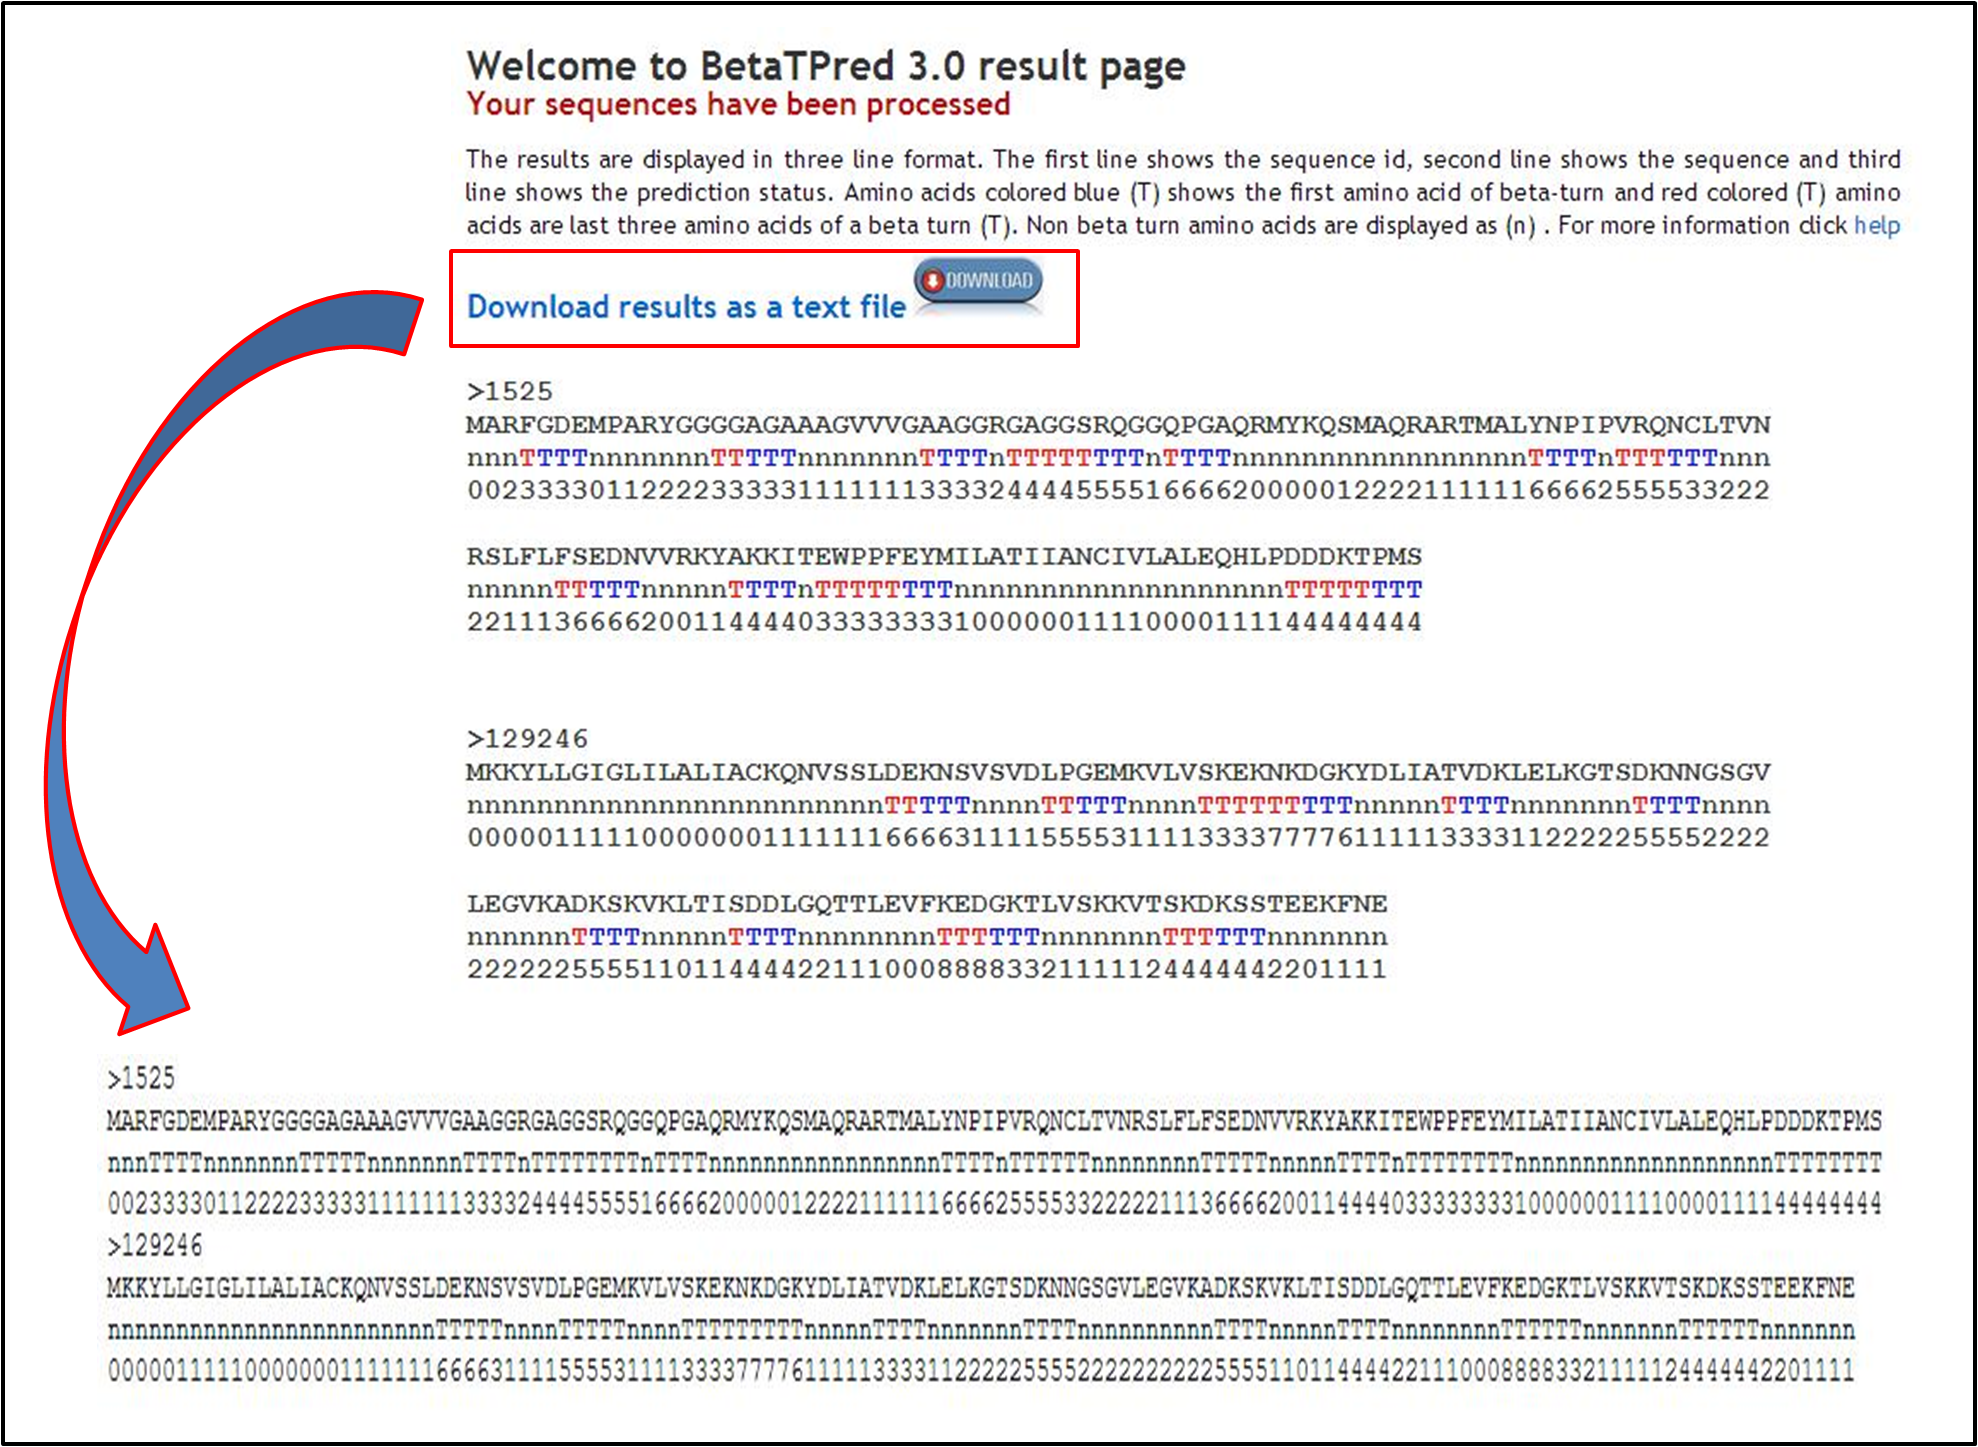
In the past statistical methods were developed to predict the beta turns based upon propensity score of beta turn. The propensity score was calculated using few hundered PDBs. We have calculate new propensity score using ~18000 PDBs. Users can predict beta turns based upon various position based propensity score. Click here to »Submit »
Designing of Beta Turn
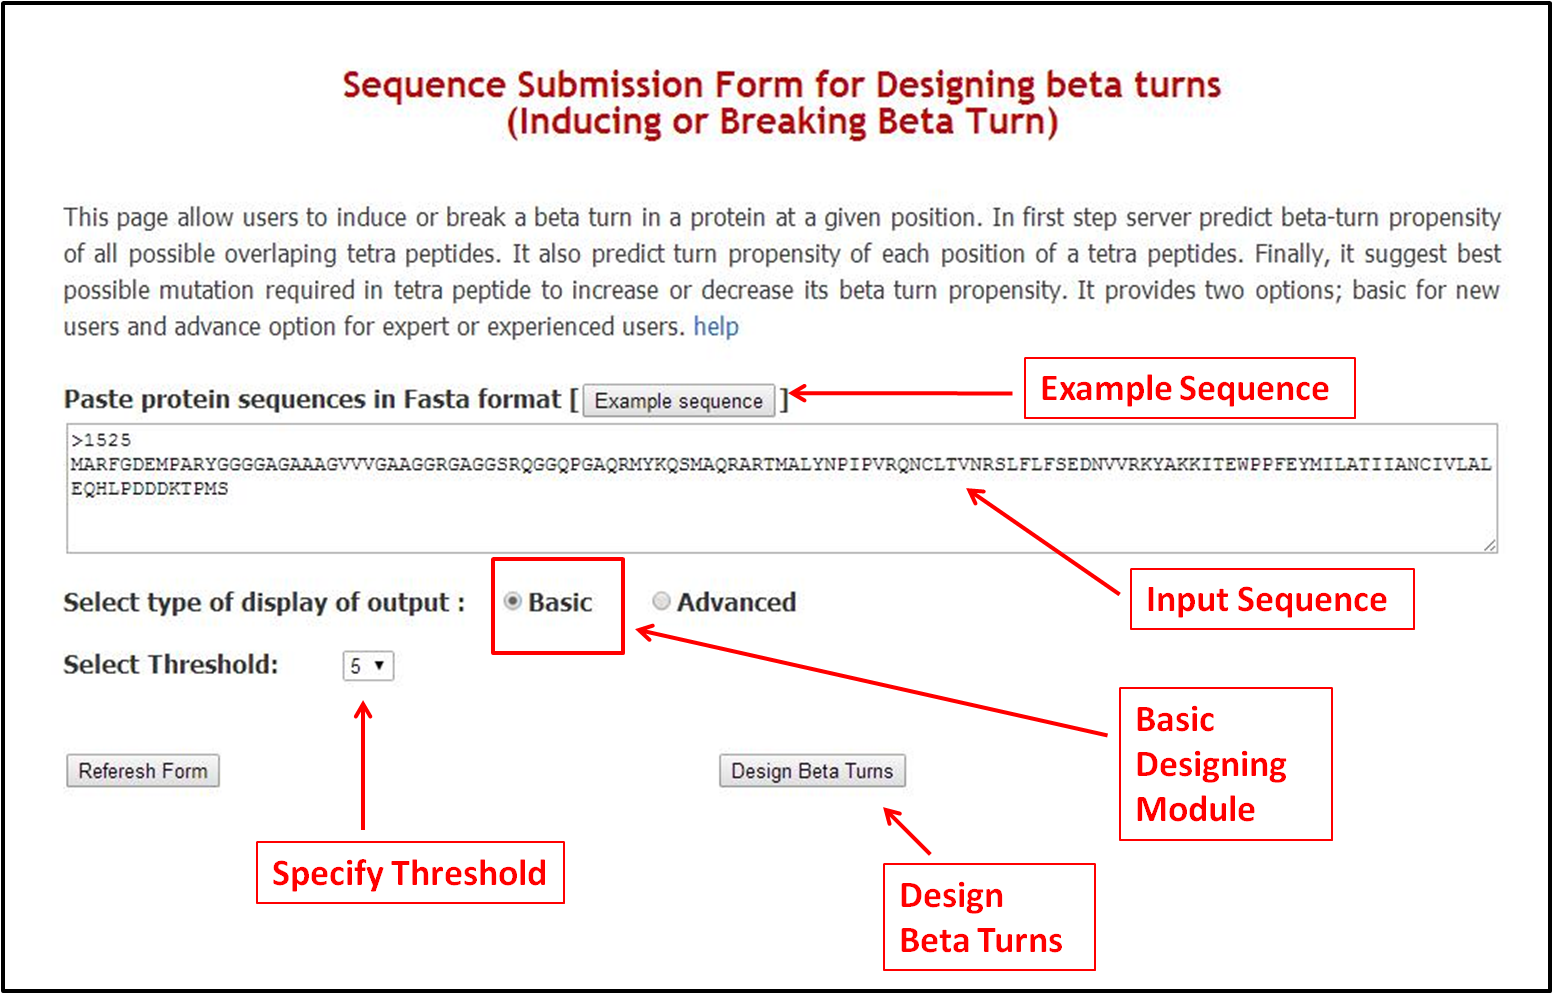
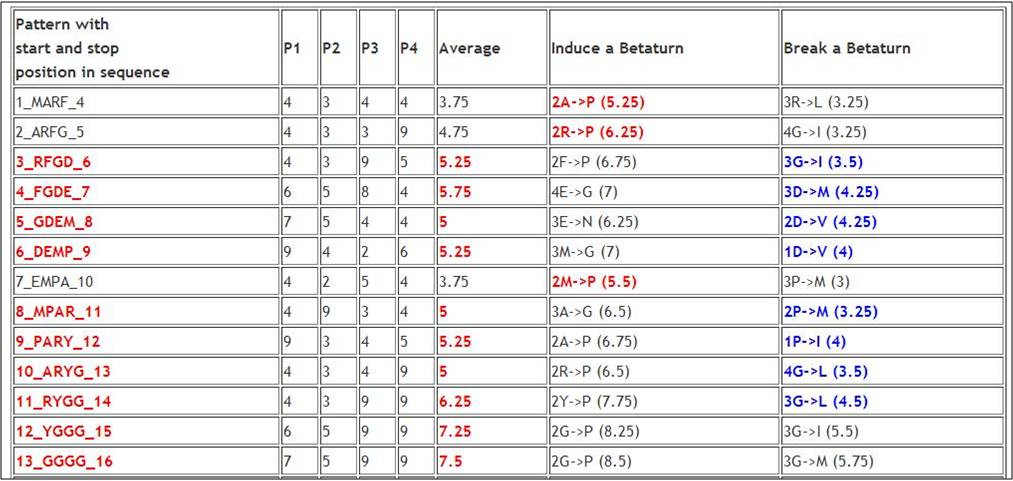
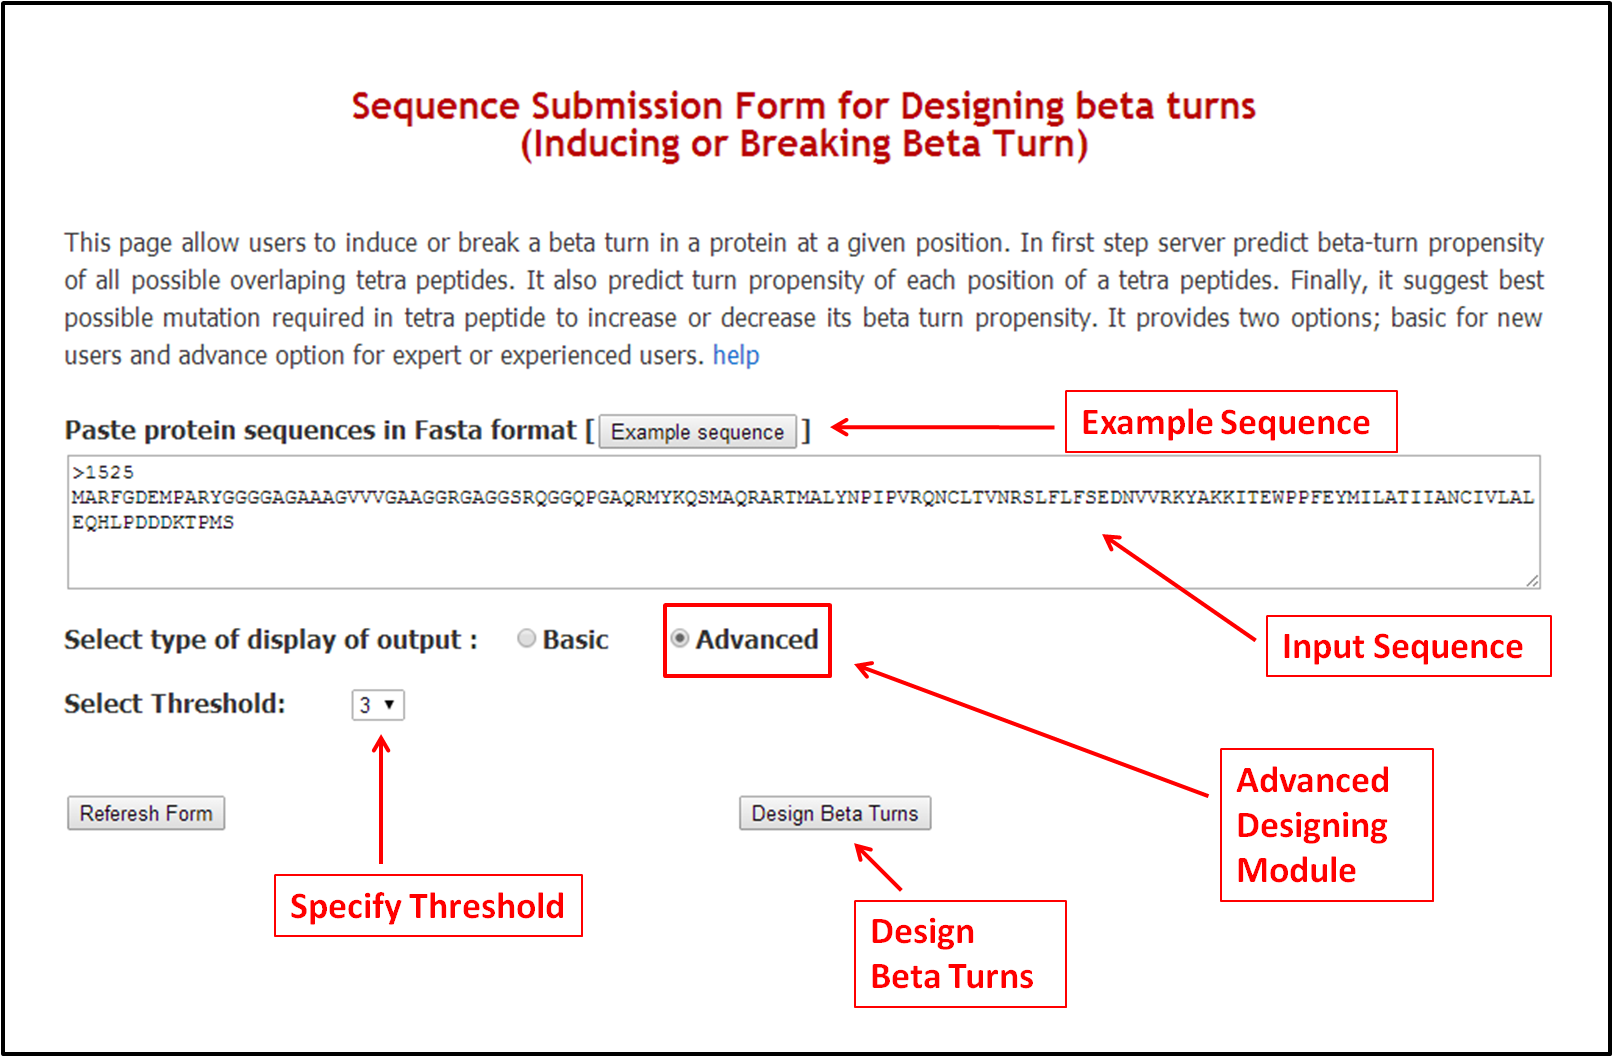
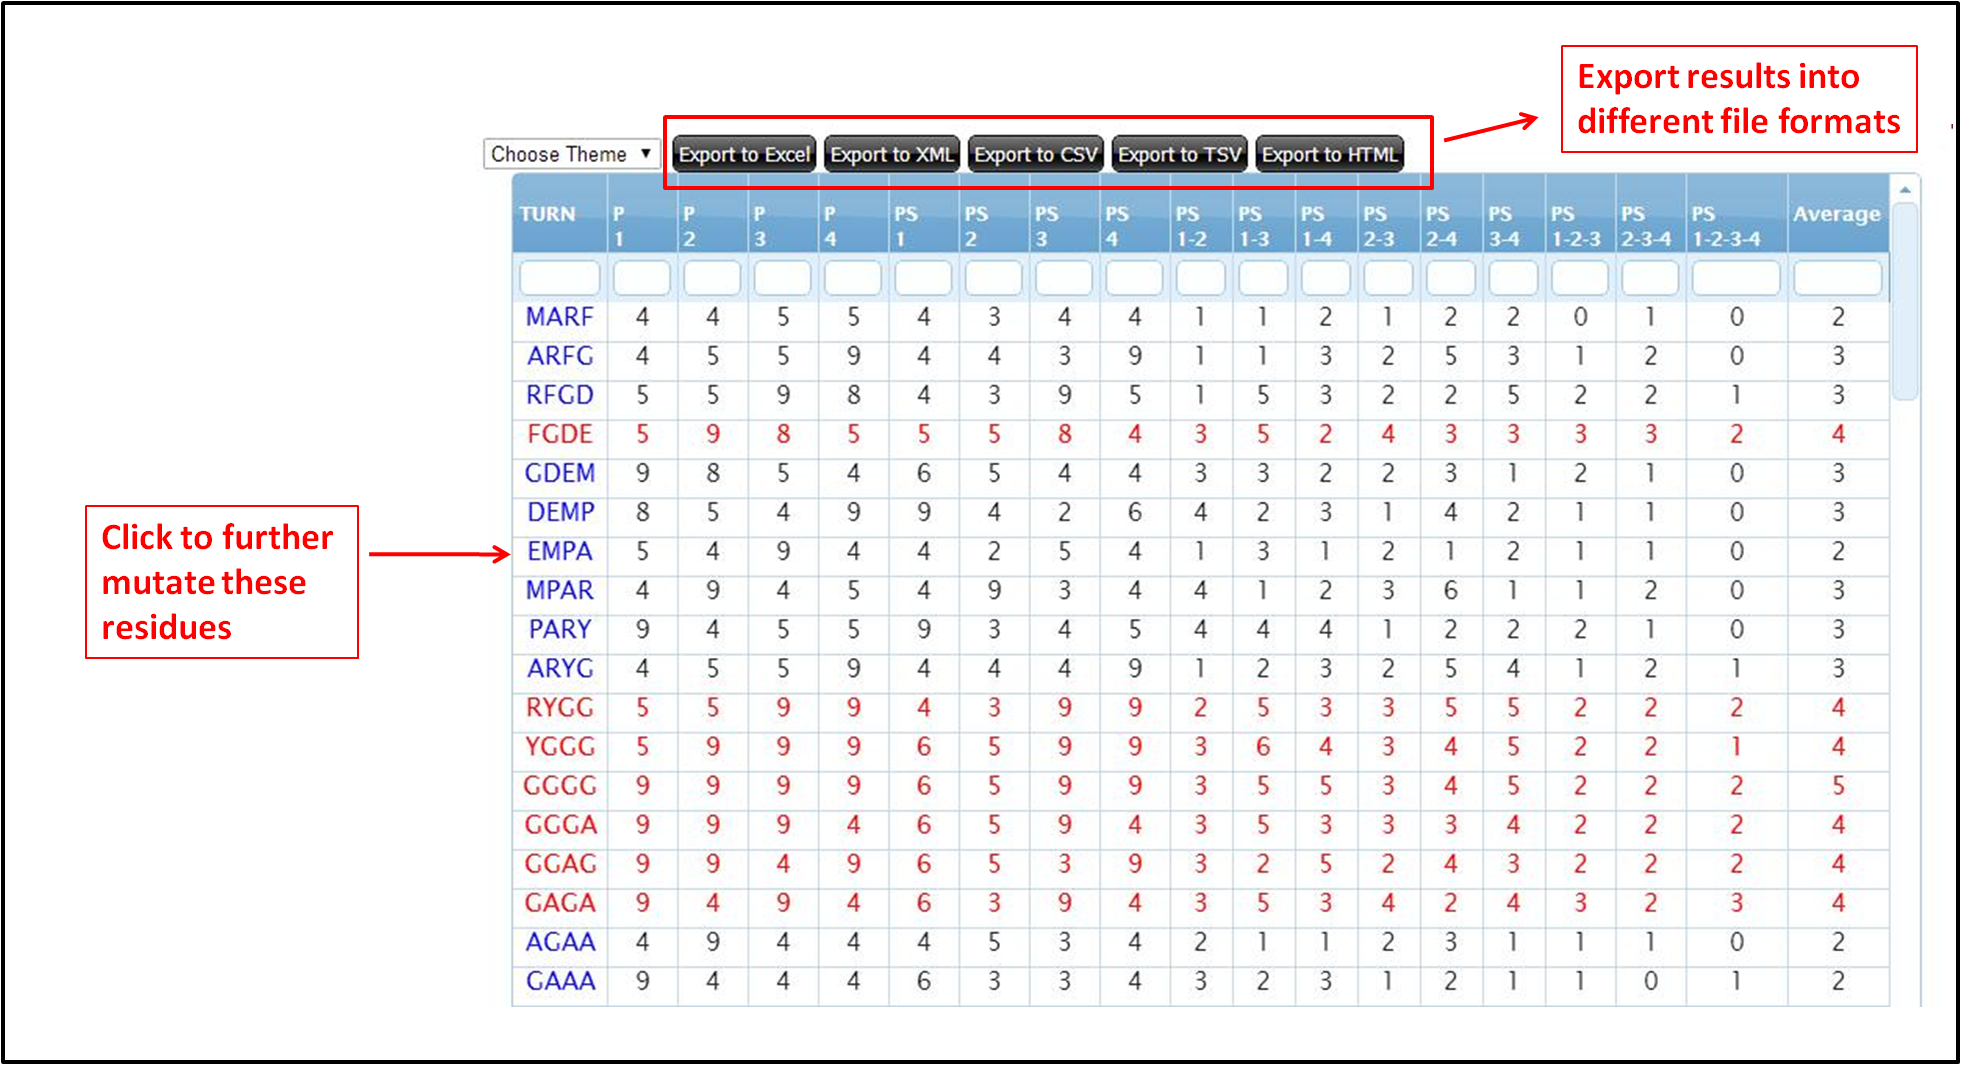
For the first time, we have developed a module thats helps user in understanding the positional preference of pairs of amino acids. First, user sequence is mapped and various propensity score are shown for all possible tetrapeptide. Second, the module performs all possible mutation in a tetrapeptide, either to increase or decrease its beta turn formation probability. Click here to »Submit »
Prediction of Beta Turn Type
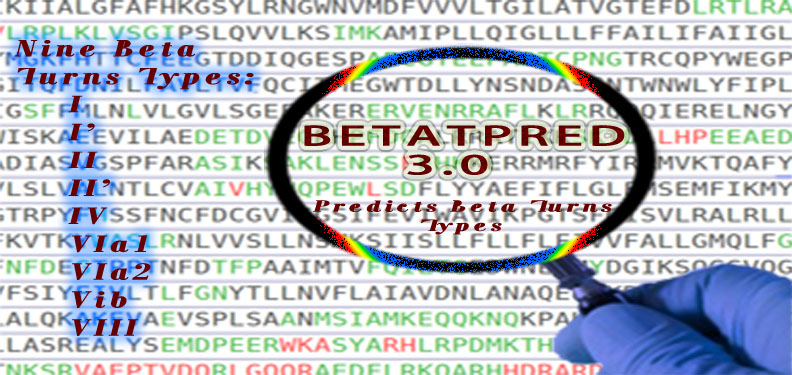
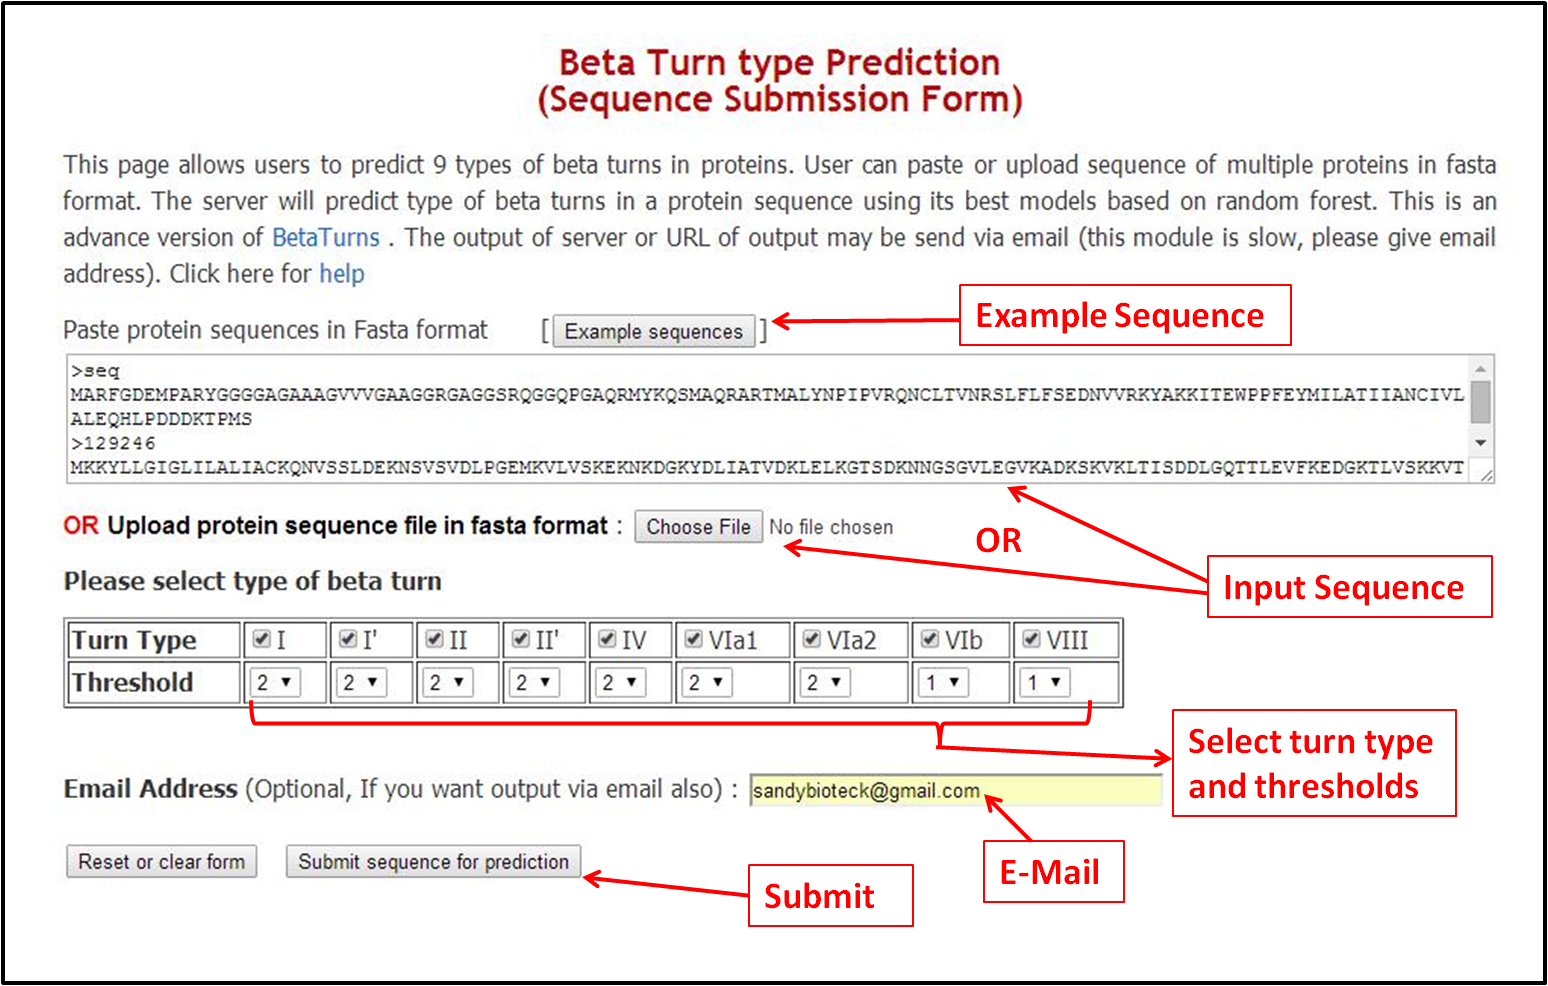
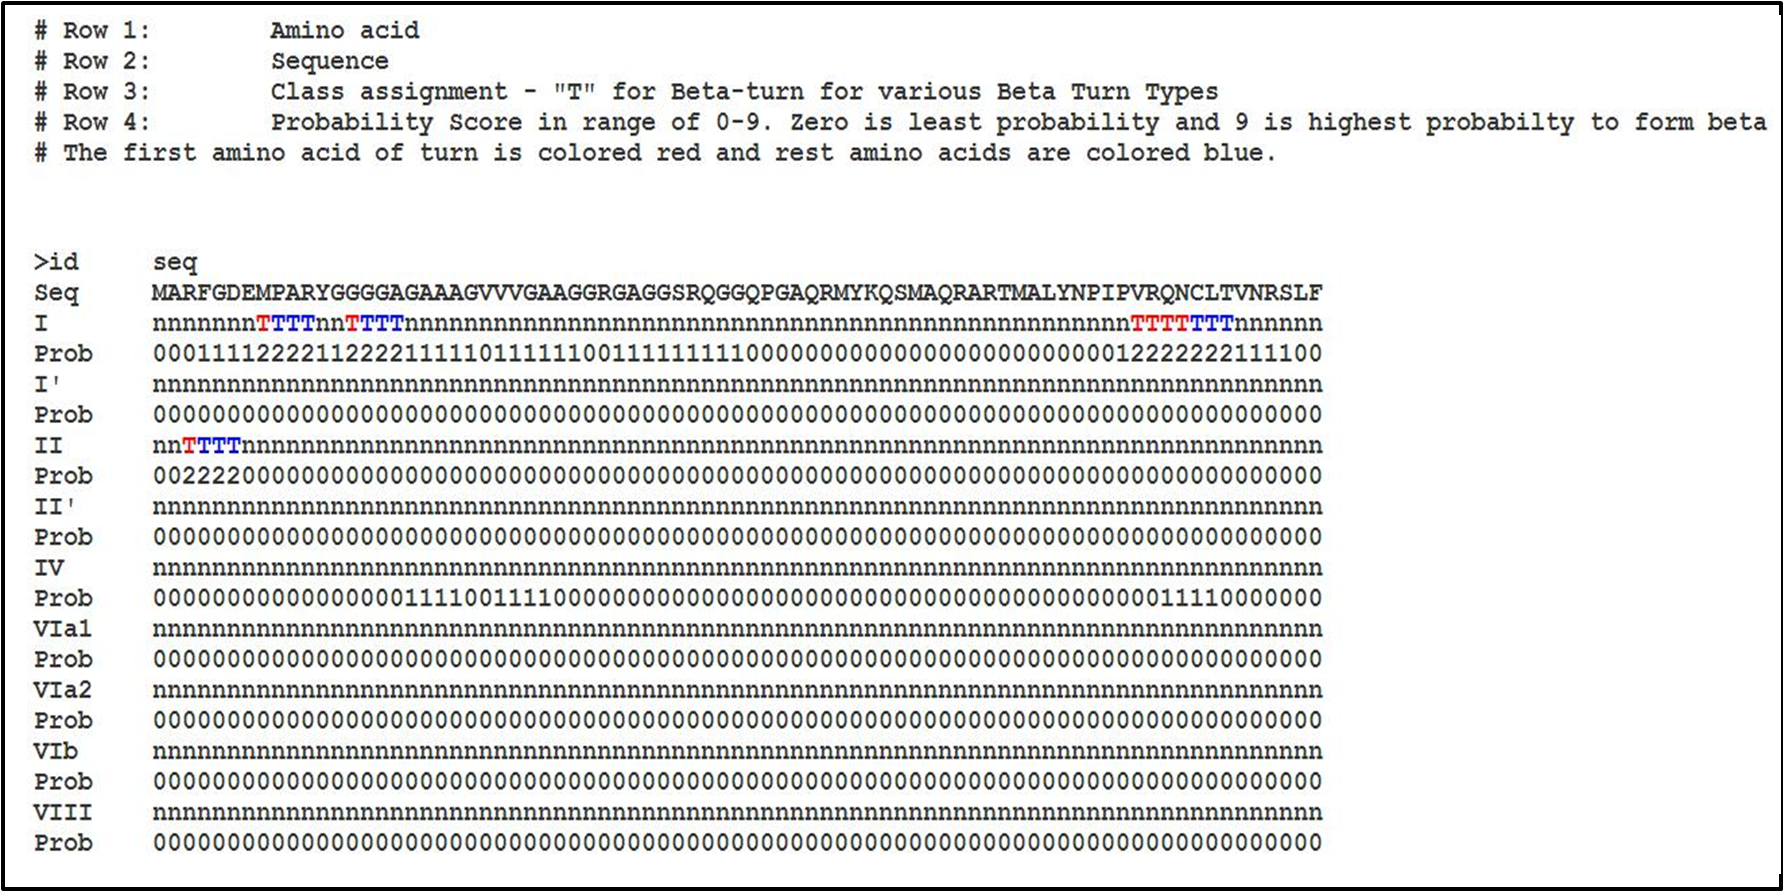
In the past numerous methods were developed to predict the beta turn types. Using the turn level approach we have significantly improved the prediction accuracy of beta turn types. To predict beta turns types in your protein click »Submit »
Algorithm
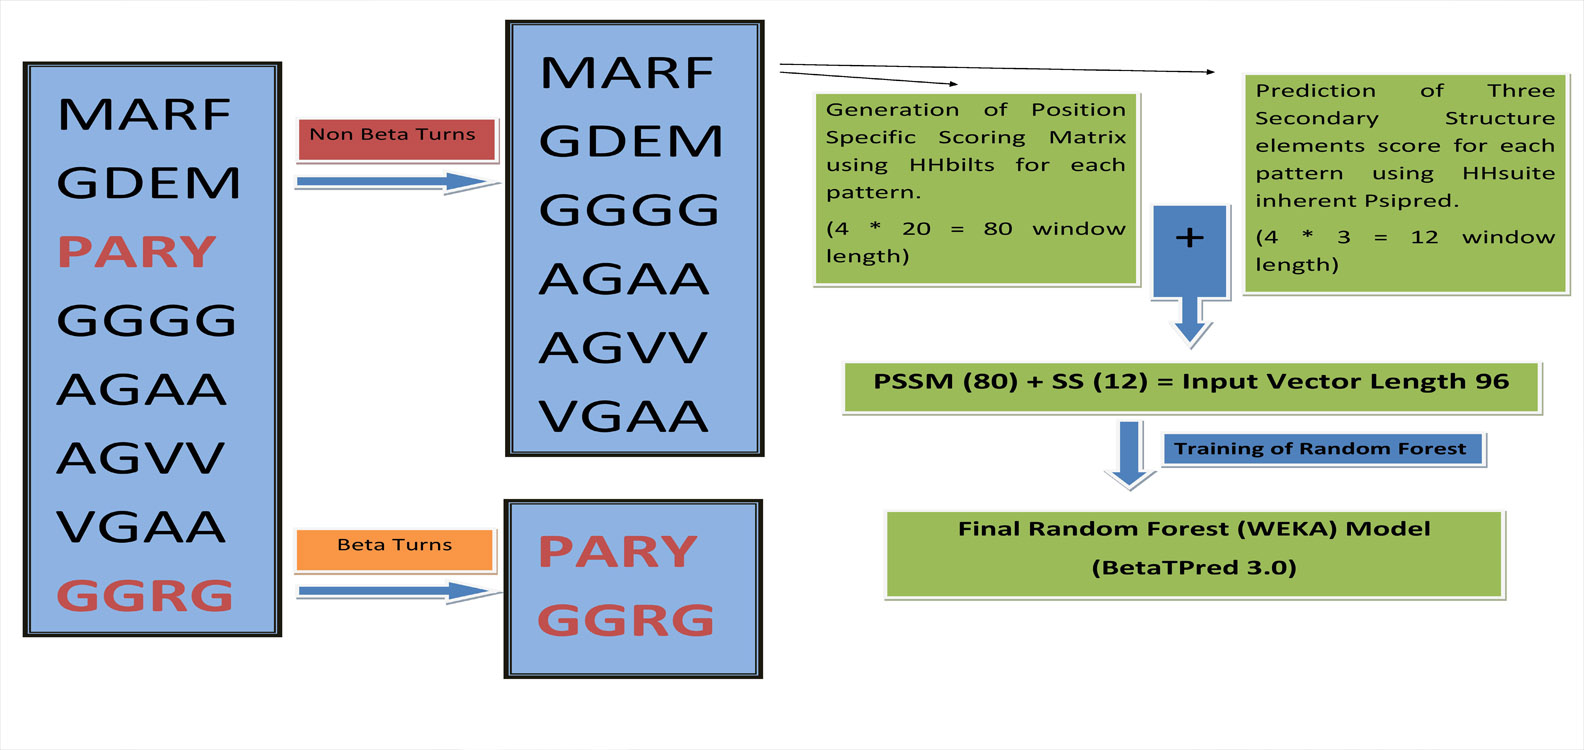
We have developed a algorithm that predcit complete beta turn, earlier algorithm predict the residue that are present in beta turn. They can predict a residue to be beta turn residue, even its neighbouring residue are non beta turn. Our algorithm has overcome all these limitation and can predict only four consecutive beta turn residues.
More »
Download dataset
To Download previously created dataset and the lastest dataset. We have created two dataset, one is 30% non-redunant and other is 90% non-redunant dataset.
More »