|
|
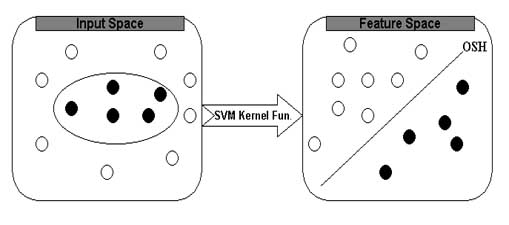
First, the inputs are formulated as feature vectors. Secondly, these feature vectors are mapped into a feature space by using the kernel function. Thirdly, a division is computed in the feature space to optimally separate to classes of training vectors. The SVM always seeks global hyperplane to separate the both classes of examples in training set and avoid overfitting. The hyperplane found by SVM is one that maximise the separating margins between both binary classes. This property of SVM is more superior in comparison to other classifiers which are based on artificial intelligence. In the present study, we have used SVM-light software to predict the subcellular localization of rice proteins. The software enables the users to define a number of parameters and also allows a choice of inbuilt kernel functions including linear, RBF and polynomial. The prediction of subcellular localization is a multi-class classification. Here, the class number was equal to four for rice proteins. The ith SVM was trained with all the samples in the ith class with positive labels and all other samples with negative labels. In this way, four SVMs were constructed for subcellular localization of proteins to chloroplast, cytoplasm, mitochondria and nucleus. An unknown sample was classified into the class that corresponded to the SVM with highest output score.
The basic idea of SVM is depicted below:

The
performance modules constructed in this study has been evaluated using
5-fold cross-validation technique. In this technique, the relevant dataset
was partitioned randomly into five equally sized sets. The training and
testing was carried out five times, each time using one distinct set for
testing and the remaining four sets for training. For evaluating the
performance of various modules, accuracy and Matthew’s correlation
coefficient (MCC) were calculated using the following equations:


where, x can be any subcellular location (Chloroplast, Cytoplasmic, Mitochondrial and Nuclear), exp(x) is the number of sequences observed in location x, p(x) is the number of correctly predicted sequences of location x, n(x) is the number of correctly predicted sequences not of location x, u(x) is the number of under predicted sequences and o(x) is the number of
over-predicted sequences.
PREDICTION APPROACHES FOLLOWED
Different approaches have been used for the subcellular localization of rice proteins in the present investigation (see detailed results in supplement material). These approaches are based on various protein features. However, we have provided only the best five classifiers for real-time predictions to the end users. Here, we would like to mention that though the PSSM-based module is statistically best over all the modules developed, it is bit slower due to PSI-BLAST searches on non-redundant database; and therefore, for larger analysis, users may opt for faster modules like amino acid composition-based classifier. For more flexibility, we have provided four other good performing modules e.g. if the user wish to use terminal-based information of his/her query sequence for prediction purpose, he/she may opt for splitted amino acid composition module which is based on N-Centre-C terminal composition of the protein sequence. If the user wishes to utilize the sequence order effects of the query sequence, the dipeptide composition-based module may be used for prediction. The method followed for developing these five classifiers is briefly discussed here:
Amino acid composition is the fraction of each amino acid in a protein.
The calculation of this traditional amino acid composition generates the 20 dimensional
input vectors which were used to train four types of SVM models for the
four types of subcellular localizations.
Dipeptide composition was used to encapsulate
the global information about each protein sequence, which gives a fixed pattern length of 400 (20 X 20). This
representation encompasses the information about amino acid composition along local order of amino acid.
Hybrid approach - I To improve the prediction accuracy, we adopted various hybrid approaches by combining different features of a protein sequence. In the first step, we developed a hybrid module by combining amino acid composition and dipeptide composition. The SVM input vector pattern was 420 (20 for amino acid and 400 for dipeptide composition). Splitted Amino Acid Composition (SAAC) Further, we divided each of the protein sequence into three parts viz. N-terminal (25 residues), centre portion and the C-terminal (25 residues) part. The amino acid composition was calculated for each part separately so that we have finally 60 (20 x 3) SVM vector pattern. Position Specific Scoring Matrix-based SVM is another module constructed by combining the evolutionary information stored in the matrix called as PSSM which is a method for detecting distantly related proteins by sequence comparison. The idea of adopting PSSM extracted from sequence profiles generated by PSI-BLAST as input information was first proposed by David Jones. This information is expressed in a position-specific scoring table (profile), which is created from a group of sequences previously aligned by PSI-BLAST. The PSSM gives the log-odds score for finding a particular matching amino acid in a target sequence.
It differs from other methods of sequence comparison in common use because any number of known sequences can be used to construct the profile, allowing more information to be used in the testing of the target sequence.
The PSSM of a protein sequence extracted from the profile of PSI-BLAST was used to generate a 400-dimensional input vector to the SVM by summing up all rows in the PSSM corresponding to the same amino acid in the primary sequence. After that, every element in this input vector was divided by the length of the sequence and then scaled to the range of 0–1 by using the standard sigmoid function: (X - minimum)/(maximum - minimum); where X is the individual PSSM score of each amino acid.
The reliability index (RI) is a commonly used measure of prediction that
provides confidence about a prediction to the users. In this study, we have followed the simple strategy of Hua, S. and Sun, Z. (2001) for assigning the reliability index (RI). The RI assignment is a
useful indication of the level of certainty in the prediction for a
particular sequence.
The RI was assigned according to the difference
between the highest and second highest SVM output scores. Therefore, we also
computed the reliability score of our prediction method based on the hybrid
approach using the following equation:

|
|


