Method Used |
EGFRpred is developed using around 3500 antiEGFR compounds, searched and compiled from ~350 research articles. EGFRpred combines the MCC based descriptor selection approach along with the machine learning techniques to predict the inhibitory property of query compound.Descriptor Calculation and Selection:Chemical descriptors were calculated using PaDEL software and fequency based Descriptor selection approach was applied to select the relevant descriptors for developing a robust prediction method. First we calculate the frequency of fingerprint X in EGFR-inhibitory molecules (A1) and EGFR non-inhibitory molecules. Next, we calculate Dscore by subtracting A1-a1. If the fingerprint X is more frequent in inhibitory molecules, Dscore will be positive. On the hand hand, if fingerprint X is less frequenct in inhibitory molecules, Dscore will be negative. The best 20 fingerprint include 10 fingerprint having maximum positive Dscore and 10 fingerprint having maximum negative Dscore. Descriptor selection method is described in the figure below: |
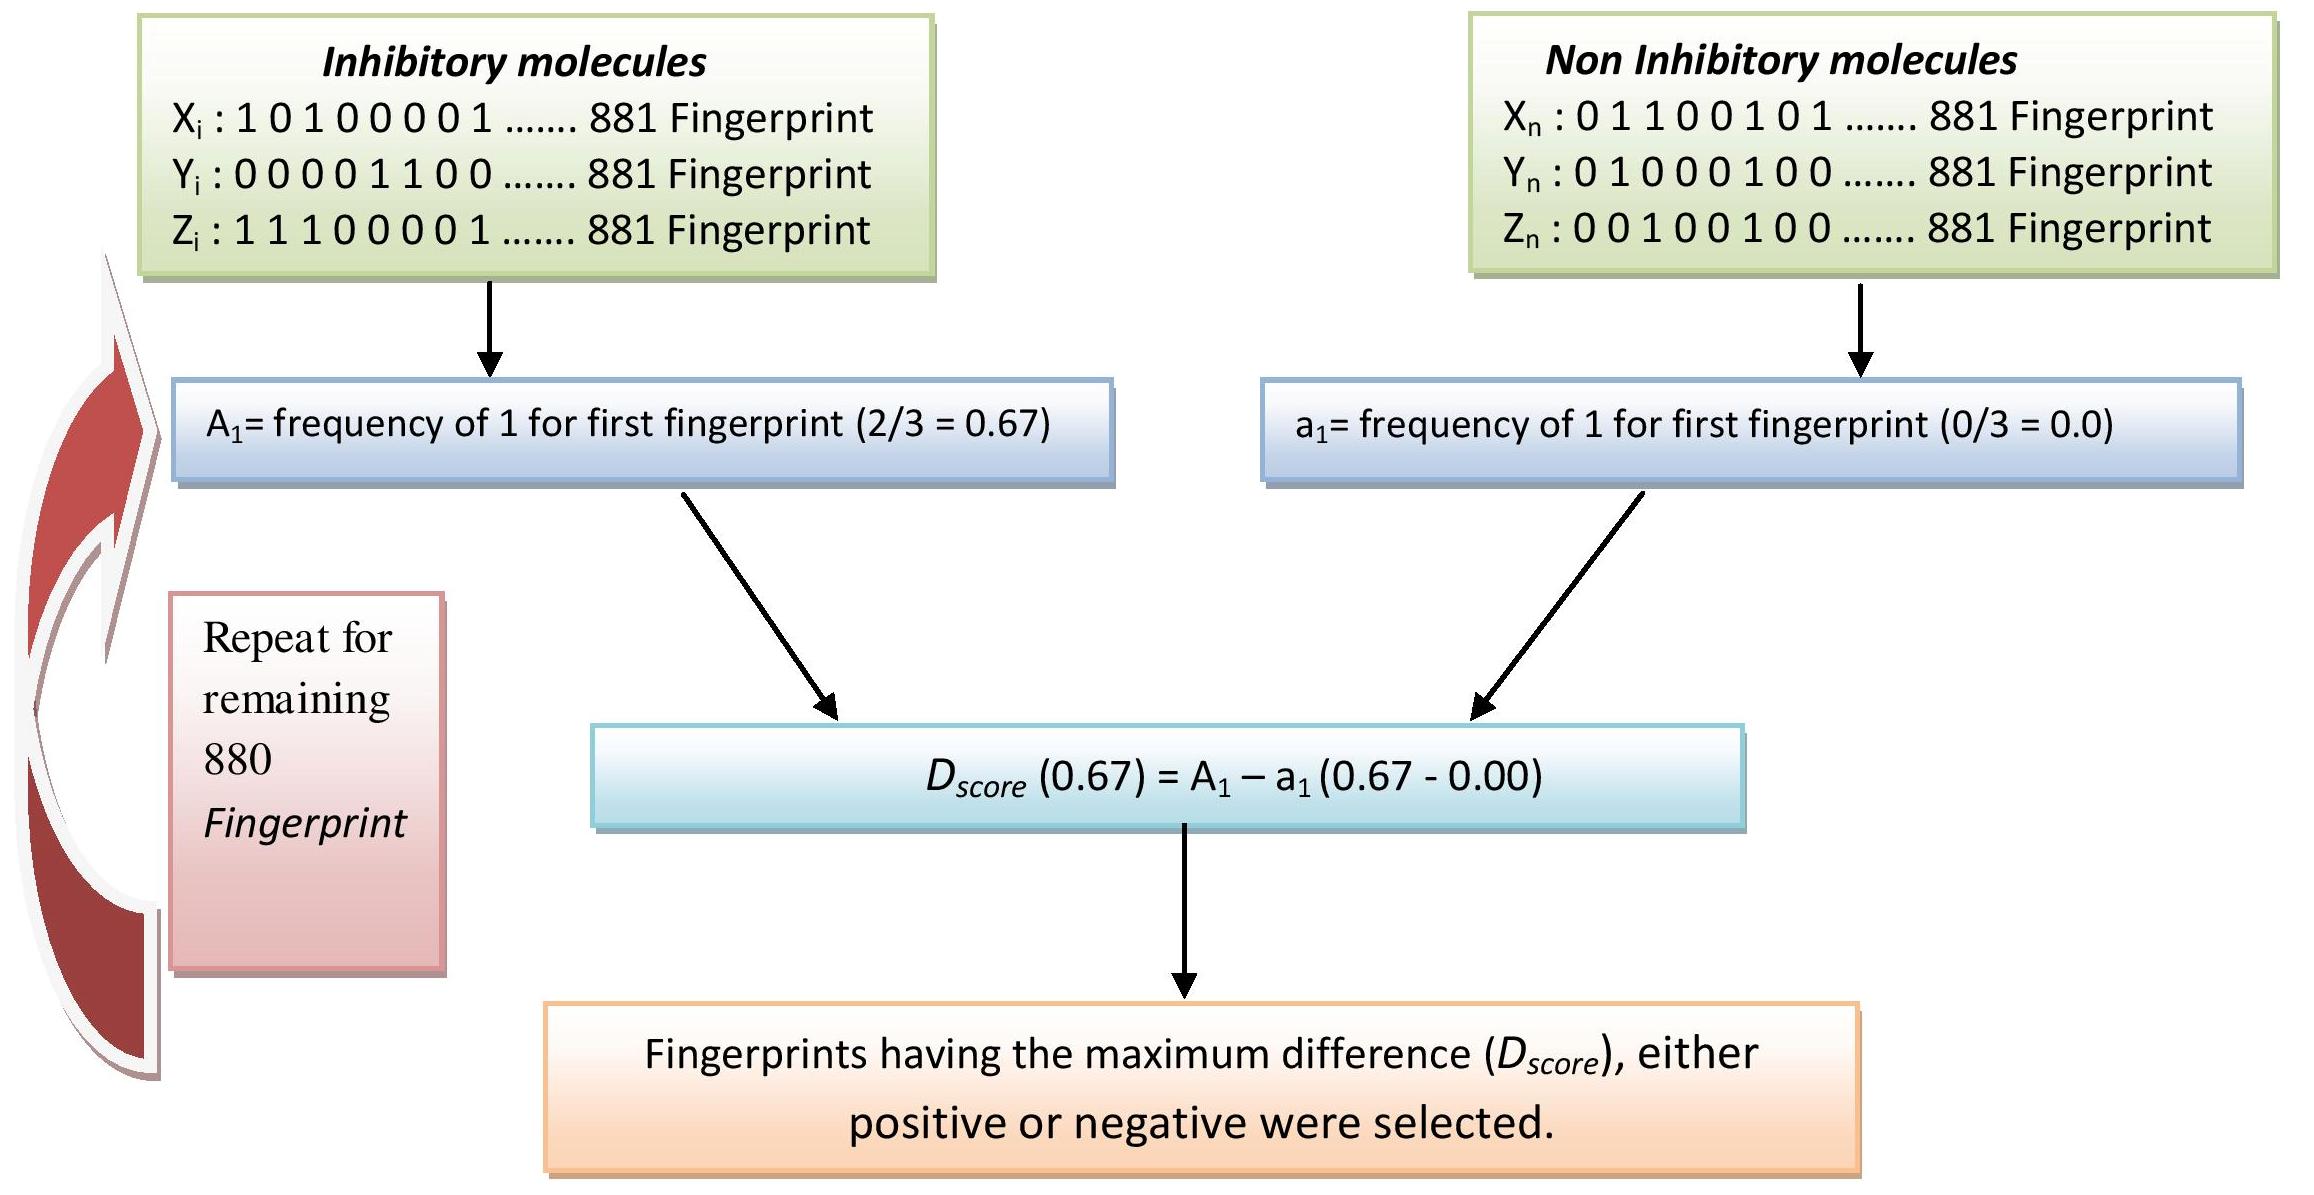 |
Figure 1: Representation of frequency based descriptor selection approach. Frequency of presence/absence of descriptor is calculated for each descriptor in all the inhibitors and non-inhibitors. For each descriptor, the difference in frequency between inhibitors and non-inhibitors is used to calculate its Dscore. Relevant descriptors are selected based on high Dscore values and are further used in prediction.Prediction and Cross Validation:In this study, 10th part of the dataset was seperated out which was used as validation dataset. Remaining 90% data was used for 5 fold cross validation in which the dataset is equally divided into 5 parts and one part is used for testing and other 4 parts are used for training. This process is repeated for all the 5 parts of the dataset. Next, we select the best 50 fingerprints using the technique described above to create best50 dataset (best 50 fingerprints was selected from Train1 to create best50 Train1, the same set of best 50 fingerprints was used to create best50 Test1 from Test1). Similarly best50 Train2-Train5, Test2-Test5 sets were created. The best50 fingerprints selected from Train1 were used to create Vld1 from validation dataset and in same fashion Vld2-5 were created. Thus, best50 Train1, Test1 and Vld1 had same set of best50 fingeprints. We perform five fold cross validation on the best50 dataset and the model developed on best50 dataset (Train1) was applied to validation dataset (Vld1). Since, there are five set of best50 Validation data, five results were obtained. We average the results of five set to obtain the final results. The Diagramatic representation of the prediction and cross validation approach is provided in the figure below. |
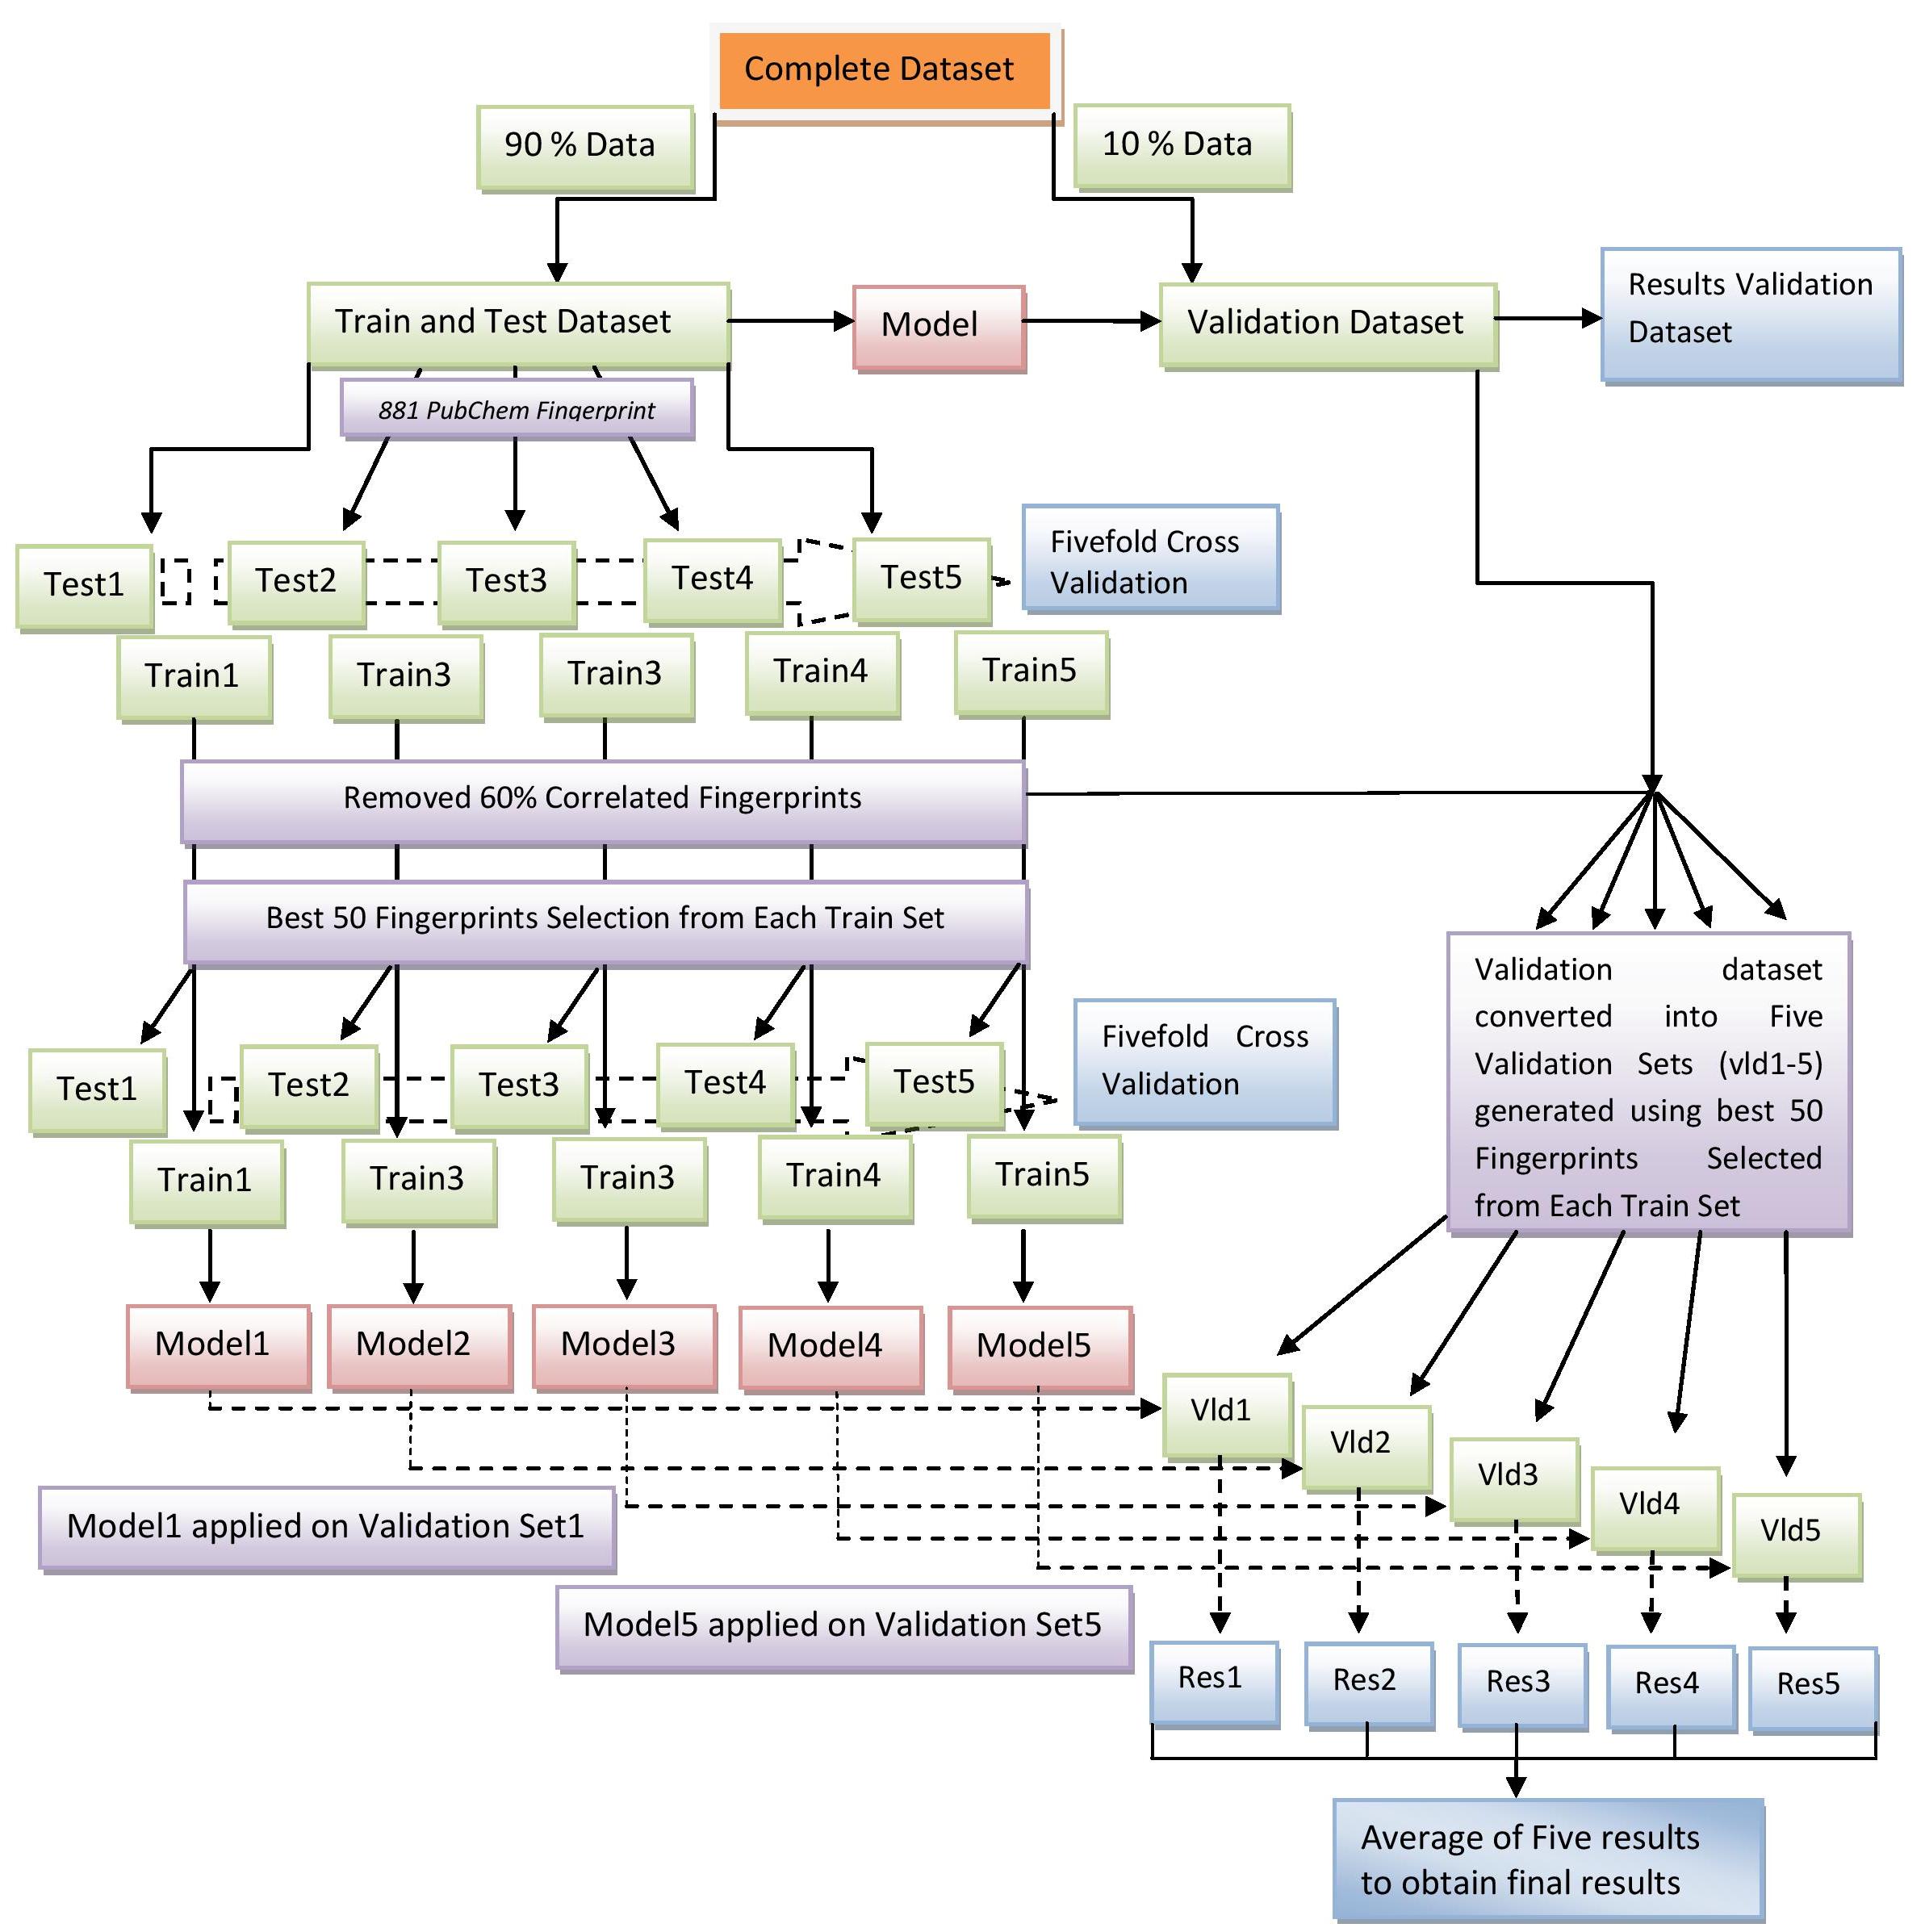 |
Figure 2: Diagramatic representation of prediction algorithm and cross validation approach used for the prediction of antiEGFR compounds. |