|
|
|
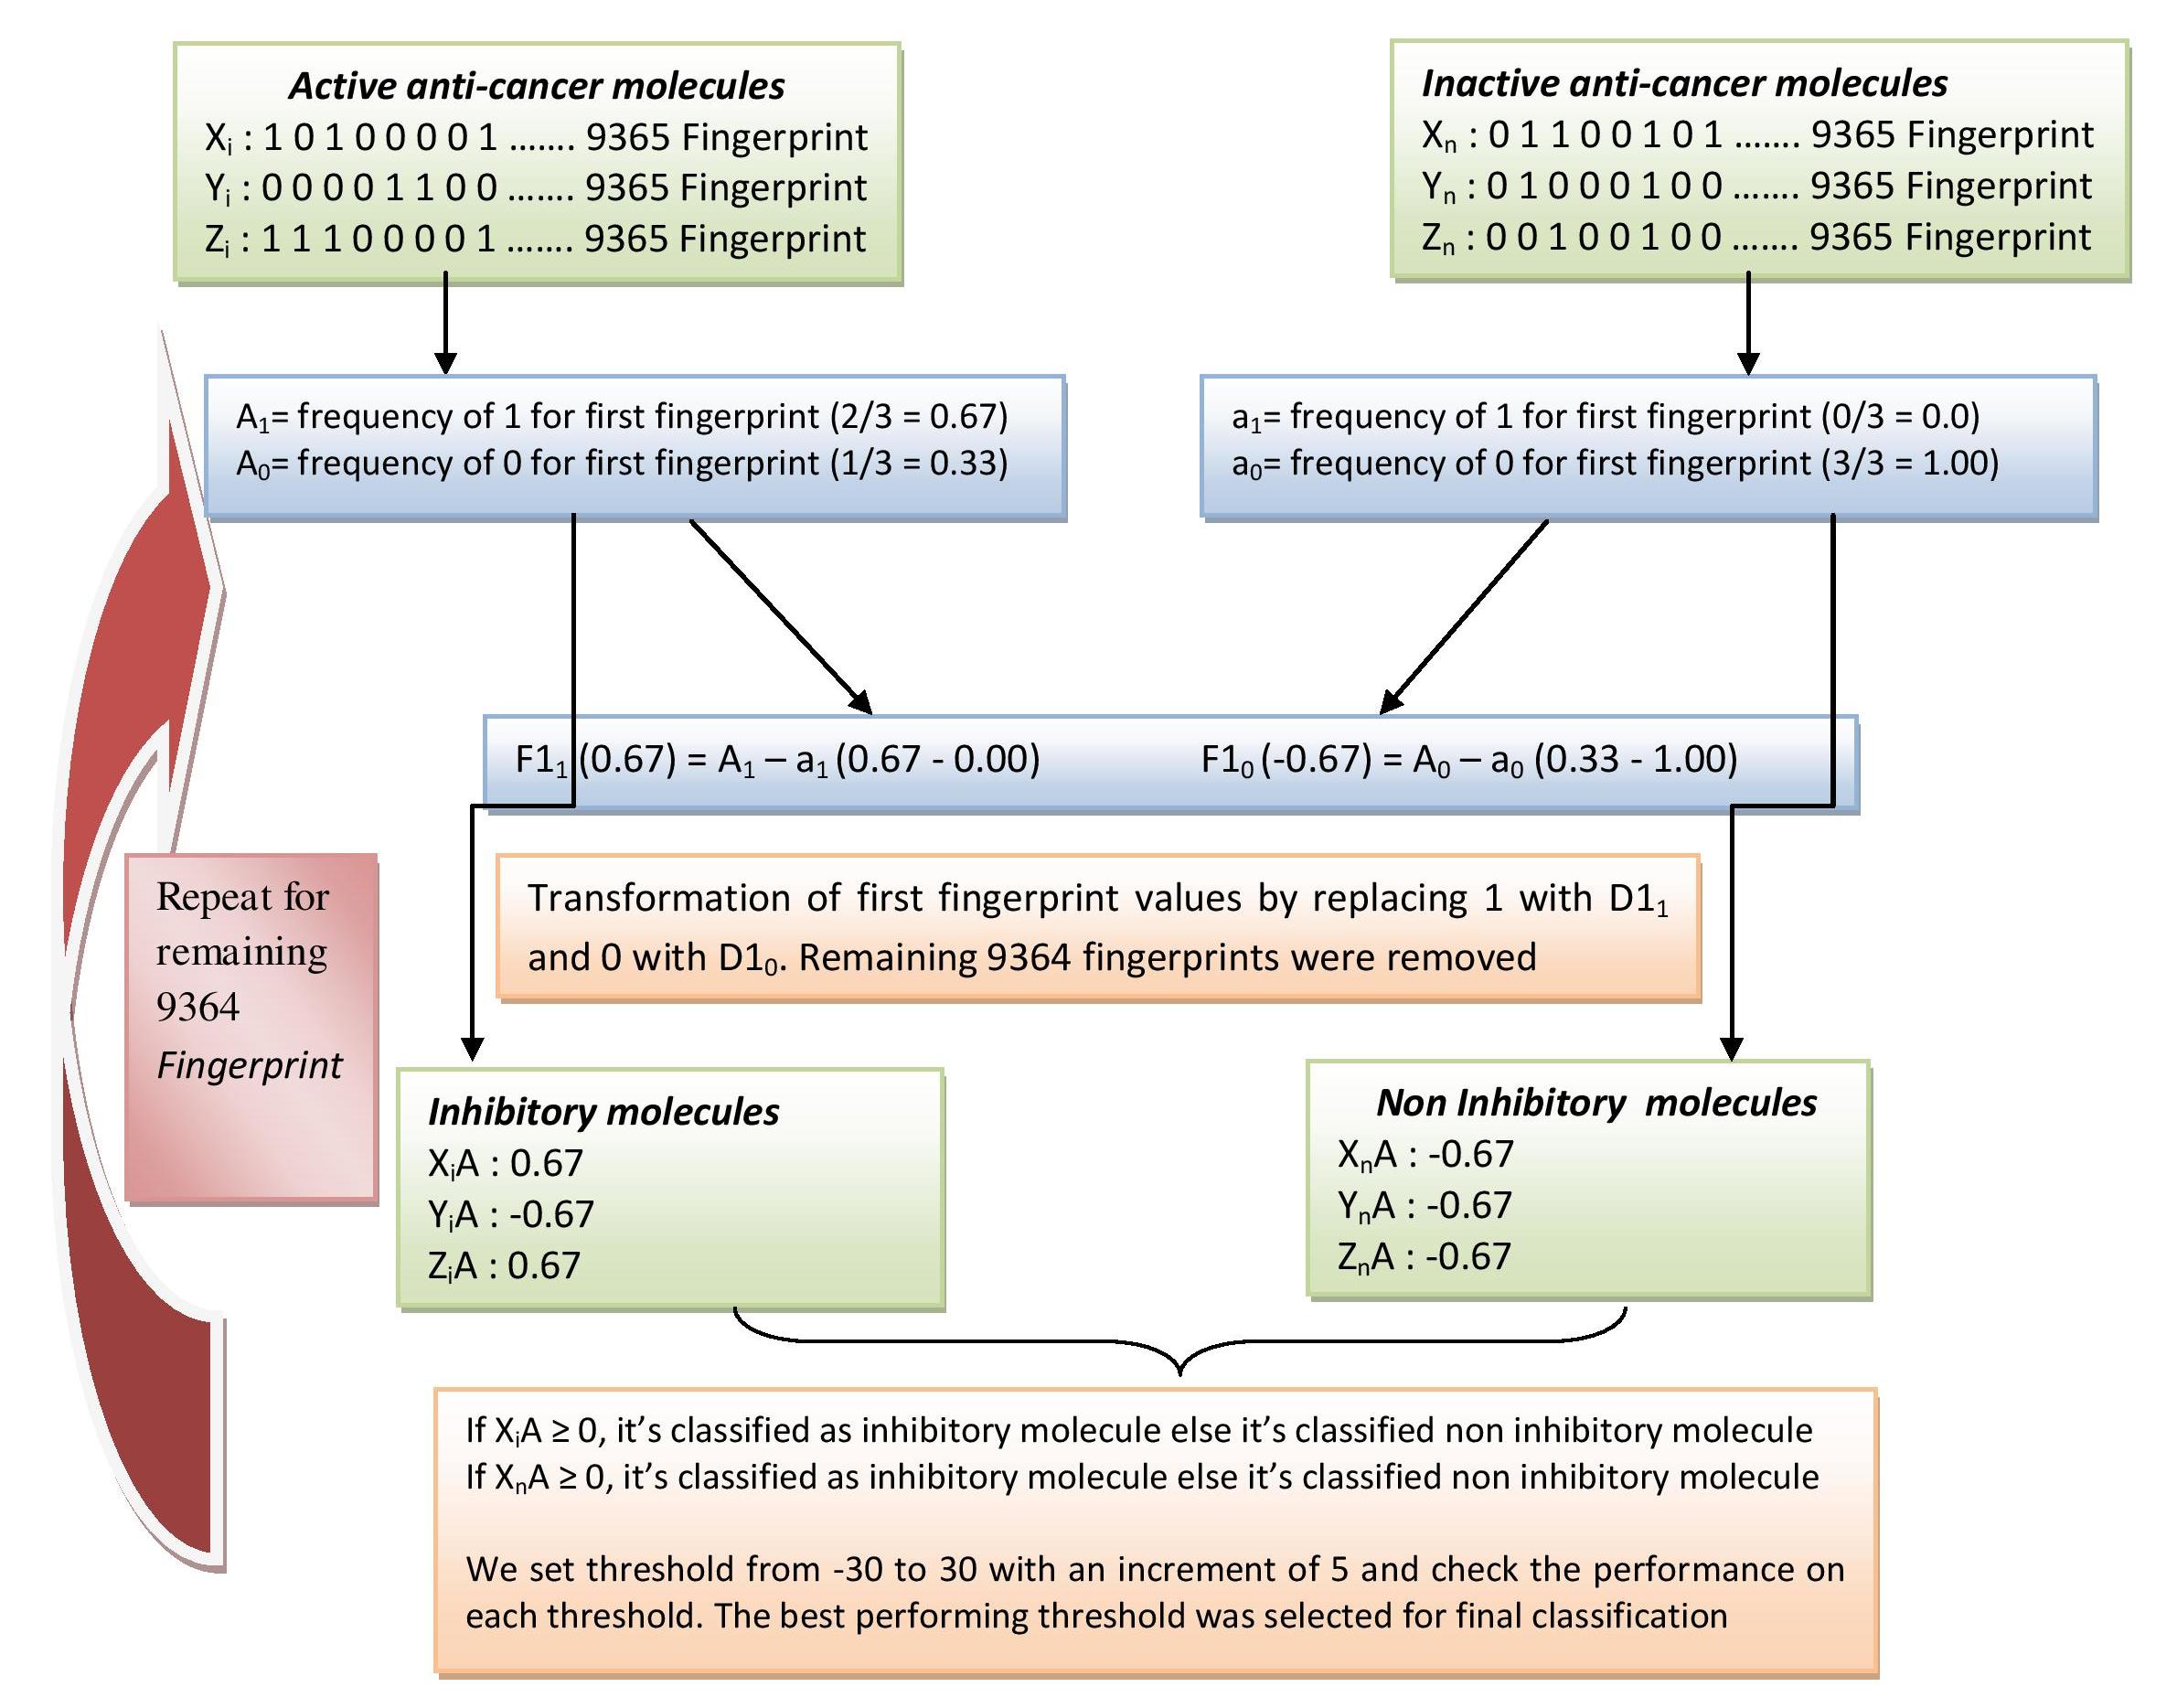
Schematic showing frequency based fingerprint classification approach (MCCa-i) |
| The following flowdiagram shows how we have identified important fingerprints using the MCCa-i appraoch. For a fingerprint (A) either its is present (having a value of 1) or absent (having a value of 0) in the given molecule. First we calculated the average of frequency of A1 (0.67) and A0 (0.33) for Active anti-cancer molecules. Similarly we calculate a1 (0.33) and a0 (1.00) for Inactive anti-cancer molecules. Next, we find how frequent is fingerprint A (F11) in Active as compare to Inactive anti-cancer molecules by subtracting A1-a1 (0.67). A positive score indicates the fingerprint is more dominating in Active anti-cancer molecules. Similarly we calculate F10, how infrequent fingerprint A in Active as compare to Inactive anti-cancer molecules. Next, we transform the original fingerprint values (1 and 0) with their respective F11 and F10 scores. In the next step, we classify the Active and Inactive anti-cancer molecules based upon their F11 and F10 score. If the score is positive, we classify the given molecule as Active anti-cancer molecules. With a negative score we classify it Inactive anti-cancer molecules. The classification threshold was varied from -30 to +30 with an increment of 5 and the performance was checked on each threshold. The best performing threshold was selected based upon its perfromace parameters in terms of Sensitivity, Specificity, Accuracy, MCC, FPR, ROC. The procedure is repeated for remaining 9364 fingerprints to obtain theri FX1 and FX0 scores. We rank the fingeprints based upon the MCC score. 126 fingerprint having MCC score => than 0.22 was selected. Click here to view 126 fingerprints in a tabular format. |
 |
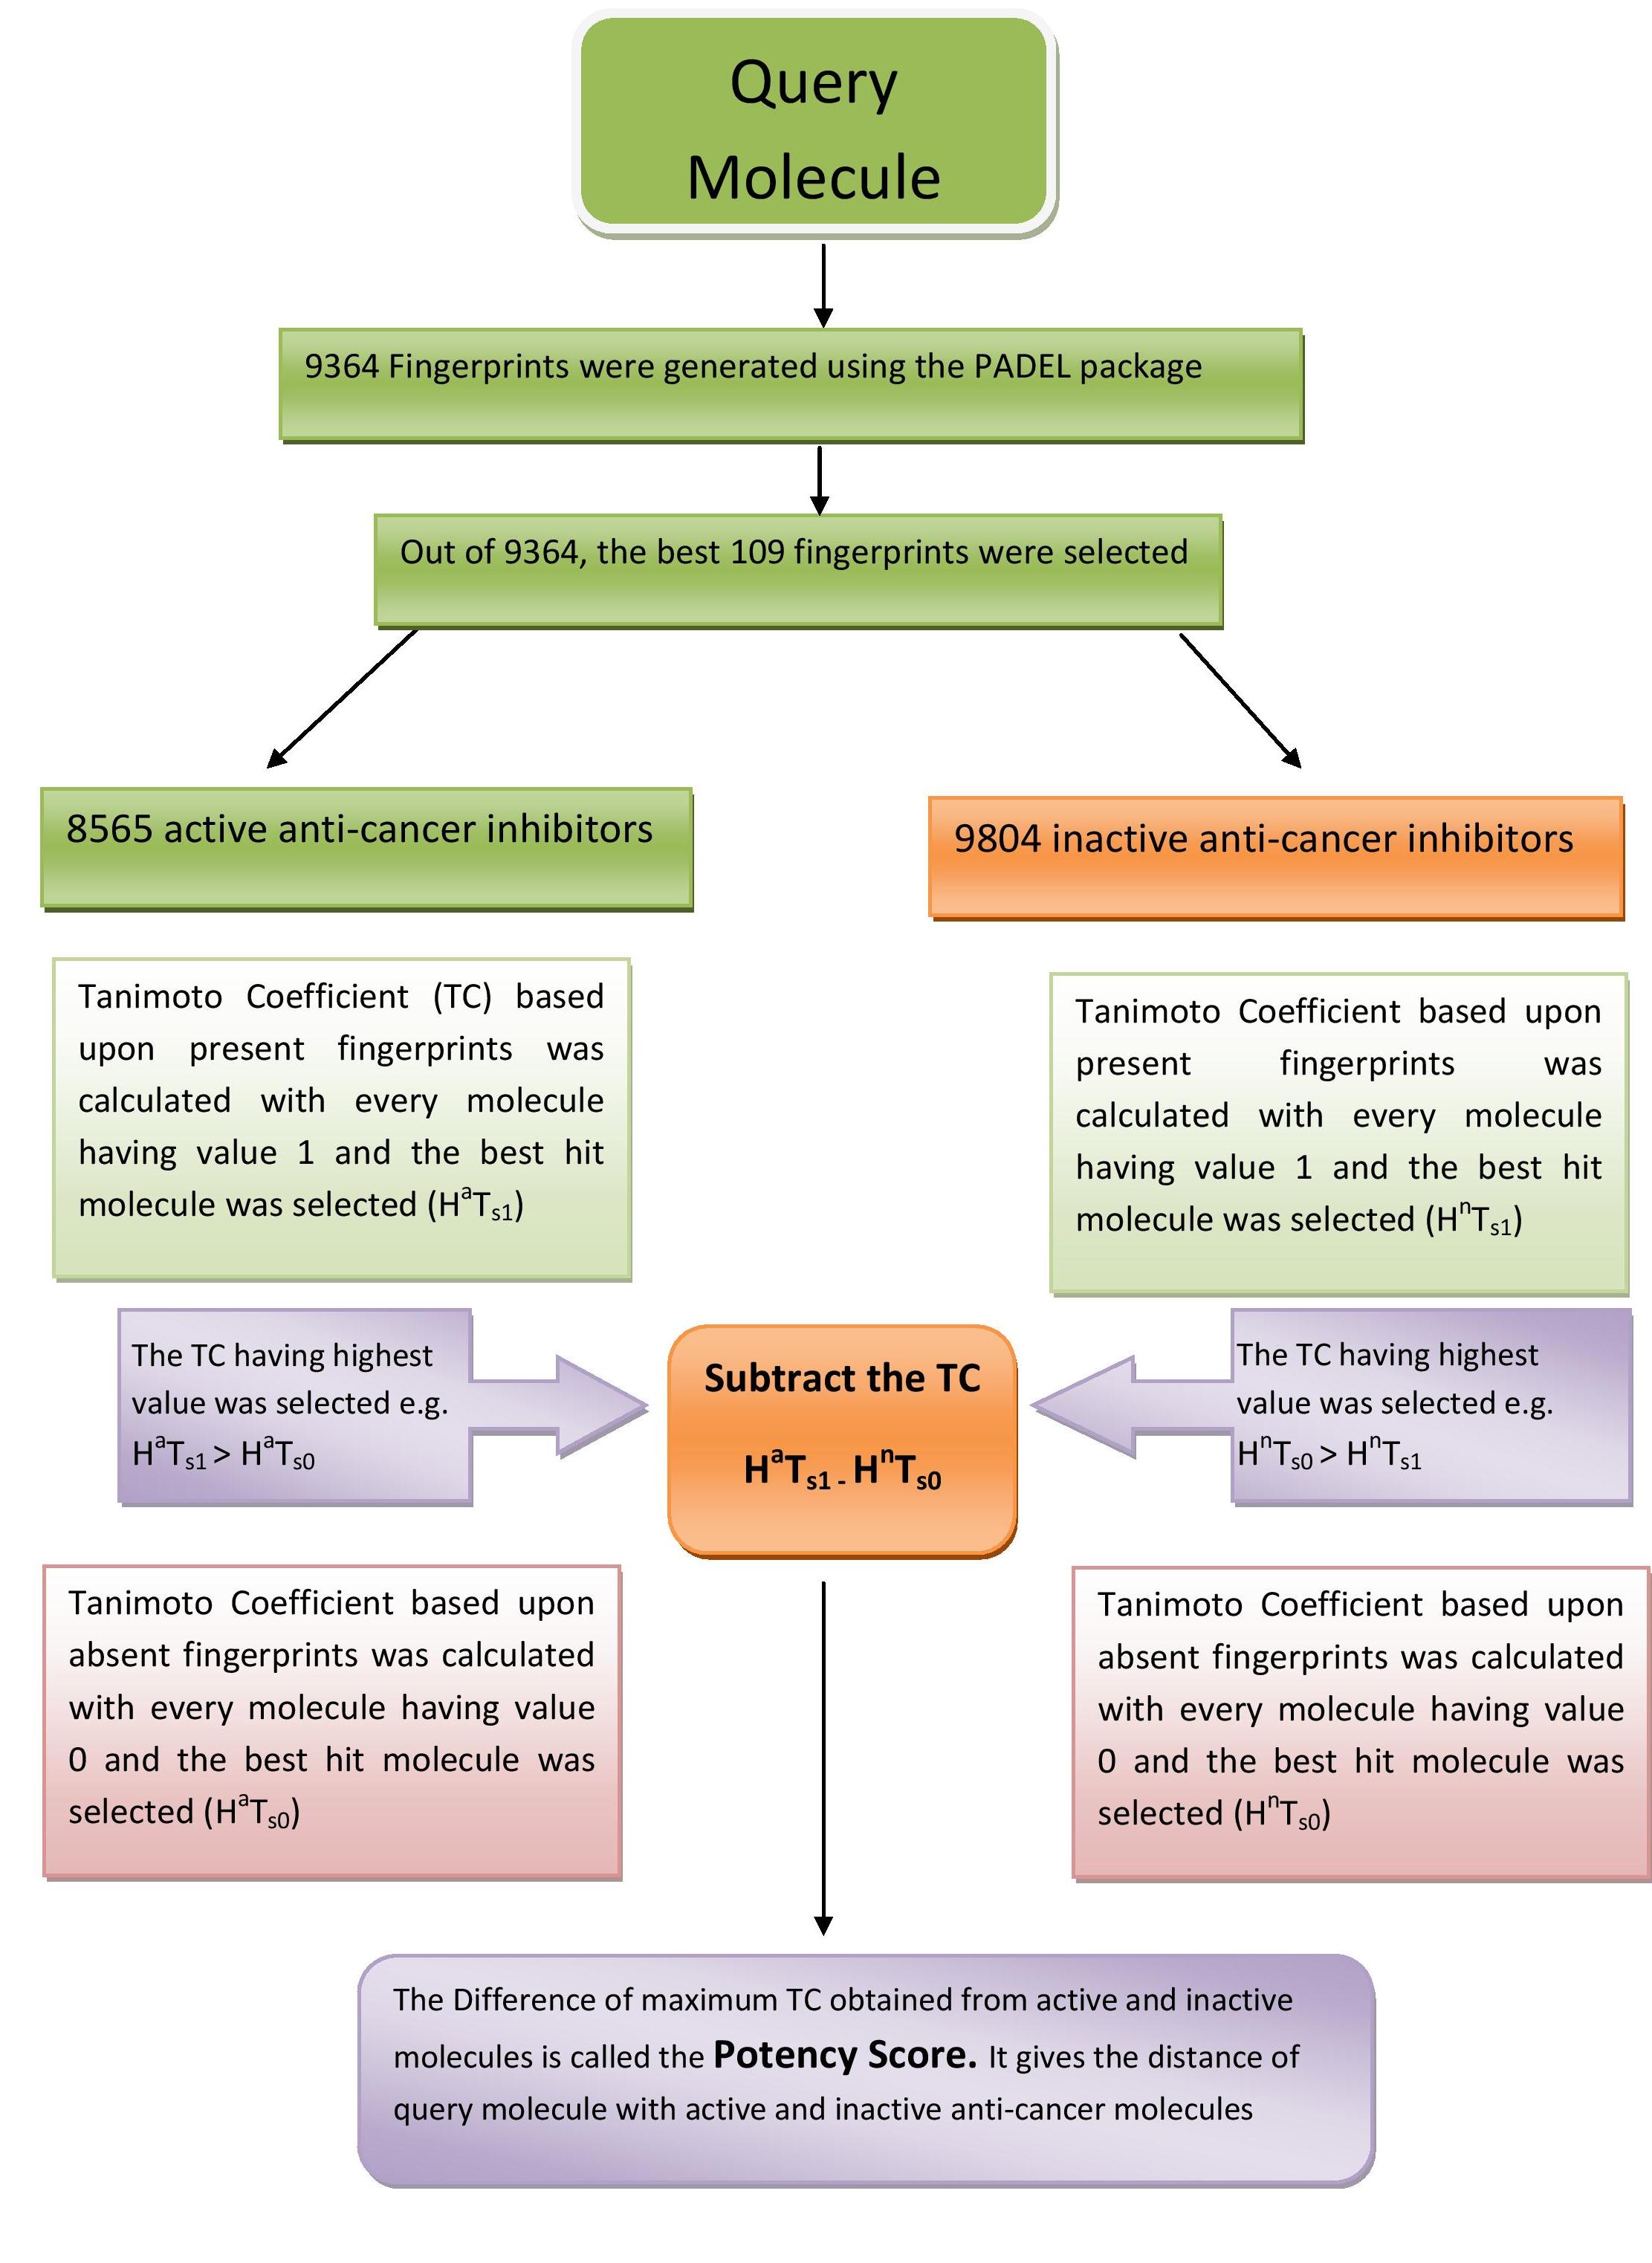
Flow chart showing the calculation of potency score |
| Some of the fingerprint out of 126 were found to be 0.6 correalted to each other. Out of two 0.6 correalted fingerprint, we retain the best performing fingerprint. After removing correalated fingerprints, we obatind 109 fingerprints. For every molecule we calculate two tanimoto coefficient TC1 (TC of fingerprint present in molecule) and TC0 (TC of fingerprint absent in molecule) with 8565 active anti-cancer inhibitors. Out of 8565 TC1 and TC0, the Highest TC1 (HaTs1) and TC0 (HaTs0) were selected. If TC1 > TC0, we select TC1 else we select TC0 as the best Tanimoto coeficient (HaTs) with active anti-cancer inhibitors. Similarly, we select the best TC (HnTs) (either TC1 (HnTs1) or TC0(HnTs0) ) with 9804 inactive anti-cancer inhibitors. Next, we calculate the potency score by subtracting the HaTs - Hnts. The potency score provides the distance of query molecule with acitve and inactive anti-cancer inhibitors. Thus, a molecule having high potencty score is more similar to active anti-cancer inhibitors as compare to inactive anti-cancer inhibitors. The potency score varies from -1 to +1, we found 0.02 is the best threshold where maximum classification performace was achieved |
 |
|


