Dataset
We have used The Cancer Genome Atlas - Skin Cutaneous Melanoma (TCGA-SKCM) dataset containing clinical (clinico-pathological and demographic) information about 449 melanoma patients. The dataset contains information regarding 7 vital clinical features viz. Age, AJCC N-stage, AJCC M-stage, AJCC T-stage, Breslow thickness, Gender, Ulceration status; overall survival time and censoring data.
Model Development
A univariate survival analysis using cox-ph regression was used to evaluate the prognostic importance of various clinical features that are generally associated with CM patients. Following results were obtained:
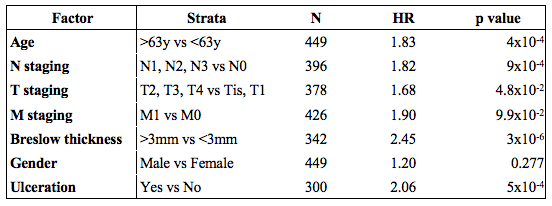
To employ the combined potential of the relevant features, different combinatorial models were developed. The best model was found to be based on the integration of four clinical features viz. N stage, M stage, Ulceration Status and Breslow Thickness. This integrated information is contained in a parameter coined as ‘Risk Grade (RG)’.
Where, RG for a given patient is defined as:
RG= r (N stage) + r (M stage) + r (Breslow Thickness) + r (Ulceration Status)
Here, ‘r’ is the risk point allocated to a clinical feature based on the conditions below:
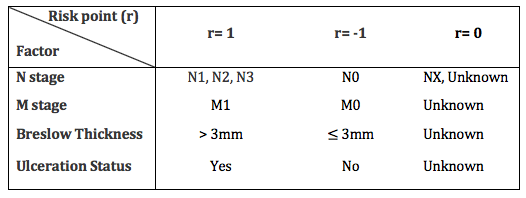
|
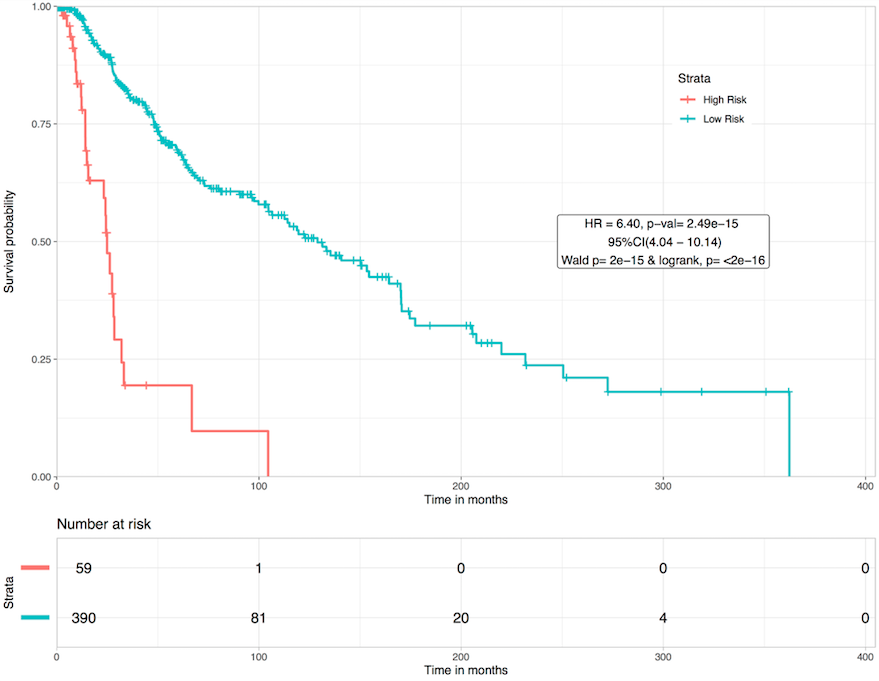
Patients were stratified as follows-
High Risk: Risk Grade (RG) >1
Low Risk: Risk Grade (RG) ≤ 1
Here, patients with RG>1 were found to be at 6.4 times more risk than patients with RG≤1 (Hazard Ratio: 6.4 and p-value~1e-15). This analysis was based on TCGA-SKCM dataset and employed standard survival (Univariate Cox-ph model) and statistical methods. The following KM plot shows the survival curves for these two risk groups
 . .
|
Server implementation
After the input information is entered, a RG value is obtained for the user. By the risk definition above, subjects can be assigned to high or low risk groups according to RG value (>1: High Risk and ≤1: Low Risk). The above KM plot is applicable for these two risk groups. For even further sub-categorization, we display the survival curve specific to the RG value group, in which the subject belongs. Year Wise survival probability (life expectancy) is shown for a simplistic and clear understanding.
|
|