[Ar-NH interactions] [Method Used] [Network Architecture] [How server works?] [Performance Measures] [References]

|
Hydrogen bonds (Baker and Hubbard, 1984; Jeffry and Saenger, 1994; Creighton, 1993), salt bridges (Horovitz et al., 1990; Pace et al., 1996)and the hydrophobic effect (Dill 1990; Lins and Brasseur 1995) all play role in protein folding and stability.The structural aspects of the"conventional" hydrogen bonds, which involve electronegative atoms such as N and O, are well established and are well investigated in proteins. However, hydrogen bonding is a very broad phenomenon that is not only restricted to N and O, but may involve less electronegative atoms. In fact, a great variety of weak hydrogen bonds such as C-H...pi,N-H...pi and C-H...O are known and these "non-conventional" hydrogen bonds have recently shown to be of greater importance in proteins (Desiraju and Steiner, 1999; Weiss, 2001). |
 |
|
Aromatic residues Phe, Tyr, Trp have pi ring system that can form a hydrogen bond to the NH moiety,thereby offering additional stability (Toth et al., 2001; Levitt and Perutz 1988). Depending on the interaction with main-chain or side chain NH moiety, the interaction can be classified as Ar-NH(backbone) or Ar-NH(side-chain) interaction respectively. The Ar-NH interactions in the dataset have been identified using the web server NCI (http://www.mrc-lmb.com.ac.uk/genome/nci/)(Babu, 2003) that is based purely on geometric criteria. The default parameters (N...pim less than and equal to 4.3A; H...pim less than or equal to 3.5A; N-H...pim and N...pim...pin less than or equal to 30o) have been used where pim represents the mid-point of pi-ring and pin represents the vector normal to the plane of the ring. Further, Ar-NH interactions have been selected which have donor and acceptor sequential separation up to three resiudes. |
|
|
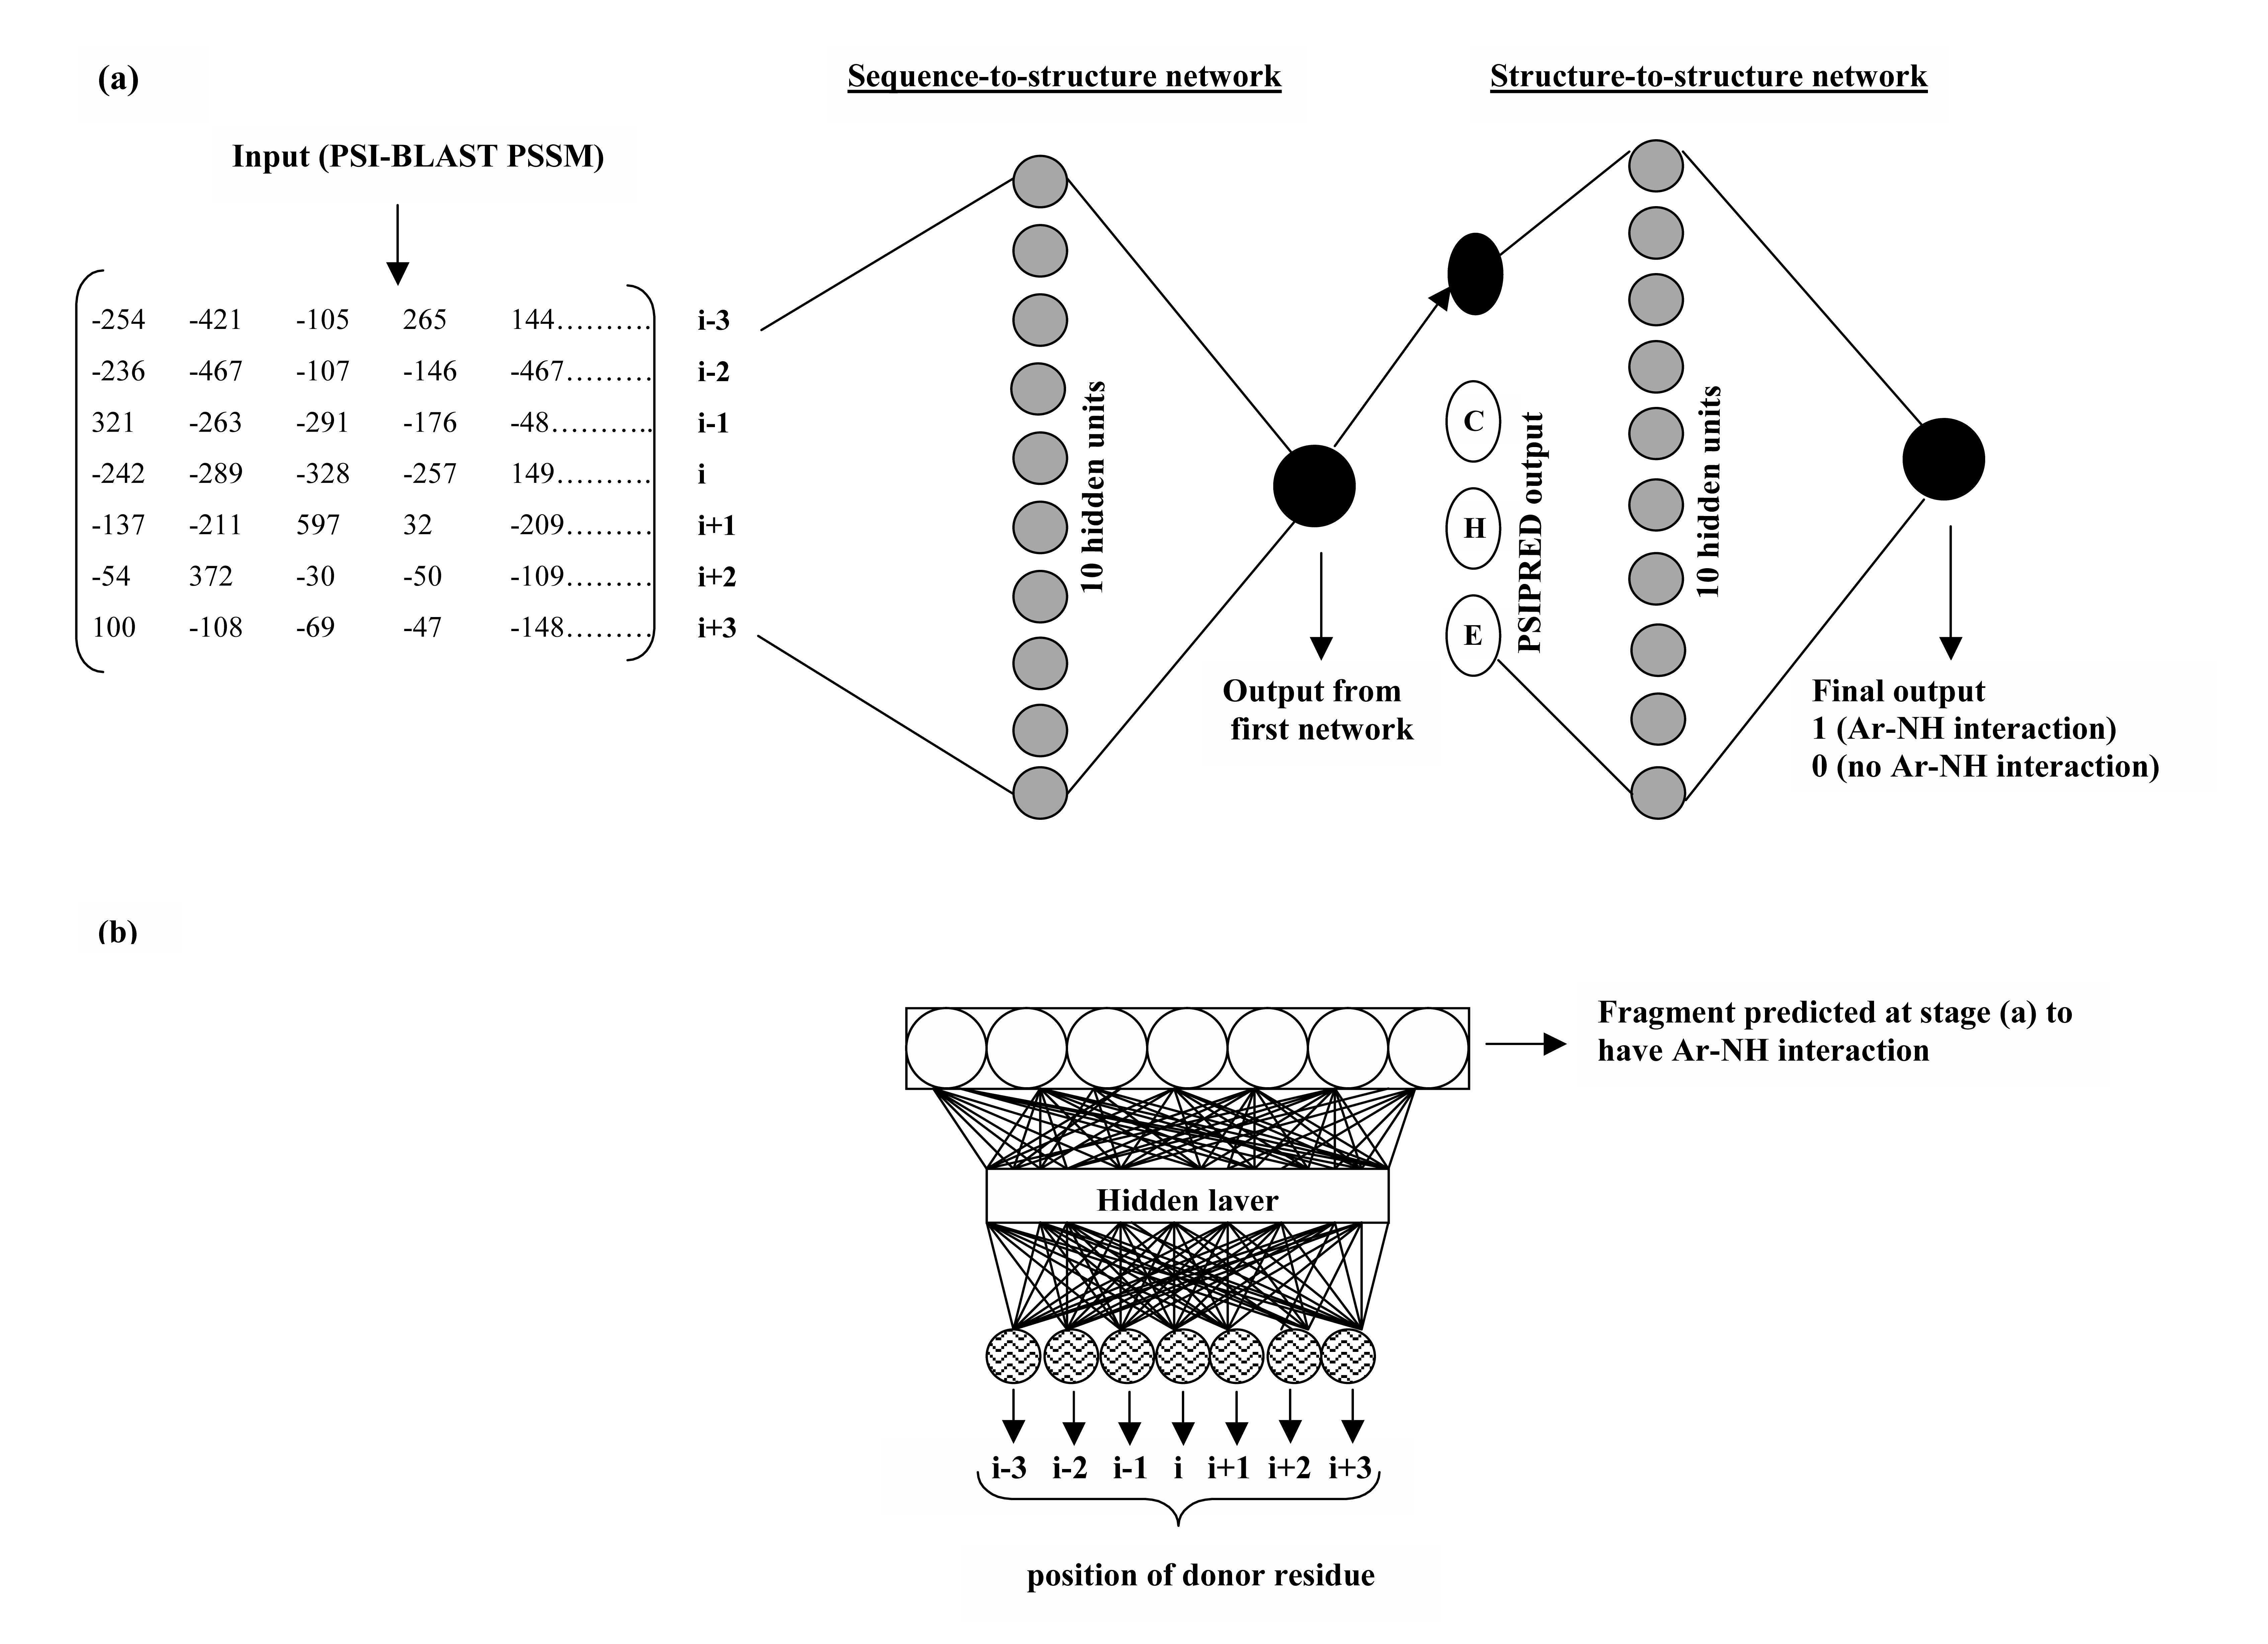
Two networks have been used: the first sequence-to-structure network and the second structure-to-structure network. The input to first networks is position specific scoring matrices generated by PSI-BLAST (Altschul et al., 1997). Using a second structure-to-structure network, the output obtained from the first network has been correlated. The input to second filtering network is prediction obtained from the first net and PSIPRED predicted secondary structure (Jones 1999). Four units encode each residue where one unit codes for interacting/non-interacting prediction and is the actual prediction score of first network. Remaining three units correspond to the reliability indices for three secondary structure states (helix, extended and coil) obtained from PSIPRED. Since at first stage, a neural network has been used to predict whether a given fragment has Ar-NH interaction or not, however it does not predict the position of the donor residue. The position of donor residue in "potential interacting fragments" (as predicted at stage 1) is predicted using a separate neural network, trained on single sequence (with amino acids as input) on the dataset containing different types of Ar-NH interactions, with donor residues present at different positions. |
|
|
The server uses two feed-forward neural networks with back-propagation (Rumelhart et al., 1986) as learning algorithm. Both the networks have input window seven residues wide and have 10 units in a single hidden layer. The target output consists of a single binary number and is 1 (having Ar-NH interaction) or 0 (having no Ar-NH interaction). The actual location/position of the donor residue in the positively predicted fragment has been further predicted using a separate network. This network has window size 7 and the target output has 7 units, each representing one of the possible Ar-NH interaction: Ar(i)-NH(i-3),Ar(i)-NH(i-2), Ar(i)-NH(i-1), Ar(i)-NH(i), Ar(i)-NH(i+1), Ar(i)-NH(i+2) and Ar(i)-NH(i+3). For a given input and set of weights, the output of the network will be 7 numbers between 0 and 1. The interaction type is the output unit having the highest activity level or value. In this work, the SNNSv4.2 neural network simulation package from Stuttgart University has been applied (Zell and Mamier, 1997, publicly available at http://www.informatik.uni-stuttgart.de/). The architecture of the whole network is shown in following figure. Figure a shows the network architecture for the prediction of Ar-NH interaction and figure b is the network used for prediction of actual location of donor residue within the positively predicted fragment. |
|
|
|
Multiple alignment or position specific scoring matrices |
|
PSIPRED uses PSI-BLAST to detect distant homologues of a query sequence and generate position specific scoring matrix (PSSM) as part of the prediction process, and here we have used these intermediate PSI-BLAST generated position specific scoring matrices as a direct input to the first level network. PSI-BLAST has been run on the standard NR(non-redundant) database. PSSM has 21 X M elements, where M is the length of the target sequence. Each element represents the likelihood of that particular residue substitution at that position. |
|
|
The Ar_NHPred server predicts the aromatic-backbone NH interactions in a given amino acid sequence in following steps:
Step I:Get PSI-BLAST position specific matricesThe secondary structure of the target sequence is predicted by PSIPRED. PSIPRED uses PSI-BLAST to detect distant homologues of a query sequence and generate position specific matrix as part of the prediction process and here we used these intermediate PSI-BLAST generated position specific scoring matrices as a direct input to the first level sequence-to-structure network. Step II: Generate patterns of window size 7 for first sequence-to-structure networkPatterns of target sequence with window size 7 are generated for prediction with
SNNS first level sequence-to-structure network.
|
|
Following four different parameters are used to measure the performance of Ar_NHPred:1. Qtotal, the percentage of correctly classified fragment, is defined as |
|
|