For the development of effective QSAR model, we have used 101 FAAH inhibitors which were studied by Kindall et. al. (Kimball, Romero et al. 2008) for SAR studies. We drew all these molecules in ChemBiodraw and saved as mol file. These molecules were α ketooxazole derivatives and its – log Ki (pKi) ranges from 0.0002- 1.2 mM. The mol files of these molecules were further used in this study. (Data available in supplementary dataset) For deriving the structural activity relationship of each molecule, we calculated descriptors using different softwares, V-life and CDK.V-life MDS (Molecular Design Suite) is a workbench for computer aided drug design (CADD) and molecule discovery. Through V-life software we have calculated ~1002 descriptors including 1D,2D and 3D descriptors. Another source is Chemistry Development Kit (CDK), a Java based open source library for structural chemo- and bioinformatics projects. by which we have compute 178 descriptors. Feature selection through Weka:
In a QSAR study, selection of a preferred set of molecular descriptors is an important step to successfully derive a predictive QSAR model. Initially, the descriptors with zero or unassigned values were excluded and then pair-wise correlation test to remove highly correlated descriptors at a cut-off value of 0.75 was executed using Rapidminer. For the further selection of relevant molecular descriptors genetic algorithm (GA) and GrredyStepwise search, has been employed to remove descriptors irrelevant for the prediction of binding affinity of ketoxazole derivatives against Fatty Acid Amide Hydrolase (FAAH). Weka Classifiers:
In this study Multiple Linear Regression algorithm prefom well to predict binding affinity of small chemical molecules in against FAAH as compare to non-linear based method (SVM, SMOreg),MLR tries to model the relationship between two or more independent descriptors and dependent variable such as y, by fitting a linear regression equation to observed data with corresponding parameters (constants) and an error term. In MLR every value of the independent variable is associated with a value of the dependent variable. The multiple linear relation between y and the {xp}s is defined by following equation:
y = β0 + β1x1 + β2x2 + ... + βpxp + ε (x)
Where y is a dependent variable, { x1, x2…….. xp} are the independent variables, { β1, β2…… βp) is the slop (beta coefficient) for particular independent variable and ε(x) is a random noise (e.g. measurement errors). In this present study MLR equation have obtained through SPSS package, was used for QSAR modeling. Performance Measures:
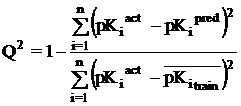
Once a regression model was constructed, goodness about the fit and statistical significance was assessed using the statistical parameters outlined below.


where n is the size of test set, m is the size of training set, pKipred is the predicted pKi and pKiact is the actual pKi, RMSE, MAE is the root mean squared error, mean absolute error between predicted & actual pKi, is the average of pKi in test set, R is the Pearson's correlation coefficient between actual and predicted value of pKi, R2 (Coefficient of determination) is the statistical parameter for proportion of variability in model. The coefficient of determination and Q2 is also the arithmetic average of all M folds.