| Experimental Data and Pattern generation:-
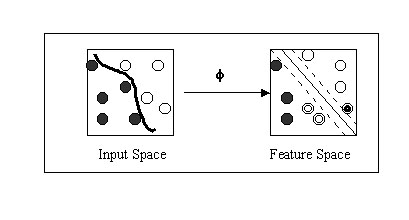
The prediction of 20S proteasome cleavage sites was done on the digests of enolase I and bovine b casein proteins by the 20S proteasome. The data for yeast enolase and b casein digests was obtained from the work of Toes et al., 2001 and Emmerich et al., 2000 respectively. The proteaosme has created 109 fragments from enolase I using 136 distinct cleavage sites. Proteasome generated 63 fragments from b casein using, 48 distinct cleavage sites. For the generation of patterns for various computational classifiers residues of enolase I and b casein were divided to cleavage and non-cleavage sites. The residue on N terminal of experimentally proven cleavage site is assigned as cleavage site where as rest of residues as non-cleavage sites. We used the sequence window size of seven amino acids. The central amino acid was designated as cleavage site for particular window configuration if the P1 cleavage site occurs at its center otherwise it is assigned as non-cleavage site. The actual cleavage site occurs between the central residue and following (C terminal) residue. The classifiers will do prediction for central residue as cleavage and non-cleavage site for particular window configuration. In case of SVMs the cleavage and non-cleavage sites are represented by "+1" and "-1" respectively. Each amino acid is represented using 21 binary encoding positions (conventional sparse encoding). The 20 amino acid are coded as given by: A=1000000000000000000000, G=010000000000000000000 and so on. The 21st bit is added for handling the incomplete or terminal parts of proteins. The patterns were generated for all classifiers (SVMs, WEKA, PEBLS) using same amino acid encoding. Independent dataset test: - More, as a demonstration of practical application and unbiased test the SVM based method was further evalvuated on an independent dataset. The dataset was obtained from the work of saxova et al., 2003 which has been used for the evaluation of already existing prediction methods.. The dataset is consist of three protein SSX2 , Nef and RUI collected from the literature. None of patterns generated from these proteins occurs in the training or testing sets used in the development of the method. Support Vector Machine (SVM): -Support vector machine (SVM) is a promising margin classifier that uses the theory from both statistics and optimization. SVM are trained with a learning algorithm from optimization theory and implement a learning bias from statistical learning theory. It draws an optimal hyperplane in a high dimensional feature space that defines a boundary that maximizes the margin between data samples in two classes, therefore giving a better generalization property. Recently SVM is being used increasingly for the purpose of solving biological problems, including MHC binders prediction, secondary structure prediction and microarray analysis. SVM perform well compared to other learning algorithms because they are effective in controlling the classifier's capacity and associated potential for overfitting. Specifically, SVMlight, which is an implementation (in C language) of SVM has been used here for the prediction of cleavage and non-cleavage sites. The SVM light package can be downloaded from http://www.joachims.org for non-commercial or academic use. The SVM light has options to select or define a kernel as well as varying kernel parameters. The relevant mathematical principal of SVM can be briefly described as follows. The n number of training examples (cleavage and non-cleavge will be represented by the (Xc, Xn) vectors. The SVM MAP the examples to high dimensional feature space and try to find out the hyper plane where the margin between the cleavage and non-cleavage vectors is maximum. The schematic representation of process has been shown below.
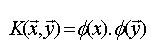
font size="2">The SVM usually map the objects to high-dimensional space by computing the corresponding kernel between two objects X and Y which are defined by this equation
The most popular kernel used for biological problem are polynomial and RBF kernel has been used in this work.The polynomail kernel is defined by following equation. The d specify the degree of polynomail kernel.
The RBF kernel can be defined by following equation.
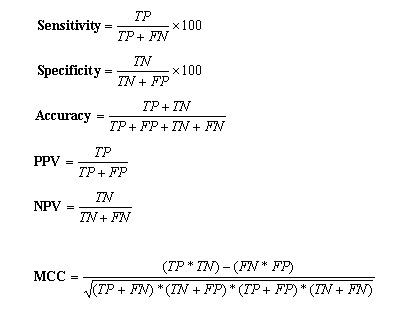
The prediction model are fine tuned by changing the parameter C , which control the training error and the margin. The performance of the different models was measured by checking on the testing set. The model having minimum error and maximum correlation coefficient on test set is considered the best model. This best model was further applied on the blind dataset that is unseen by the prediction model. Evaluation of Method Performance: -The five set cross-validation has been used to develop and evaluate the performance of the prediction methods. In five set cross-validation, five subsets of data has been constructed randomly from the dataset. The datasets for SVM, WEKA and PEBLS consist of training and testing set. The training set is consists of four subsets and the testing is done on the remaining fifth set. This process is reapted five times so that each subset can be can be used for testing and training. In this way the five models were generated in the five set cross-validation. The final prediction results have been averaged over the five testing sets.Performence Measures:Six parameters have been used in present work to measure the performance of 20S proteaosme prediction method as described by Kesmir et al., 2002. These five parameters were derived from four scalar quantities: TP (number of correctly identified cleavage sites), TN (number of correctly identified non-cleavage sites), FP (experimentally verified non-cleavage sites, predicted as cleavage sites) and FN (experimentally verified cleavage sites predicted as non-cleavage sites). The parameters derived from these values are as follows i) sensitivity, is the percentage of correctly identified cleavage sites; ii) specificity, is the percentage of correctly identified non-cleavage sites; iii) PPV and NPV are positive and negative prediction value respectively; iv) accuracy, is the percentage of correctly identified cleavage and non-cleavage sites. v) Matthew's Correlation coefficient (MCC), is more stringent measure of prediction accuracy accounts for both under and over-predictions. These parameters are calculated by using the following equations:
Results: After running hours of computational power the paramaerters of various kernels were optimised to obtain the best results. The best results are obtained after five set cross-validation.The second degree of polynomail is able to discriminate between cleavage and non-cleavage sites. The value of C , r, s parameters are also optimised. The value of the gammam factor of RBF kernerl is optimised to .01. The value of regualtory parameter C is optimised to 1.The SVM trained on invitro digested data can predict the 84% of cleavage sites. The further evaluation of this method on an independent data achieved an MCC of 0.43 which outperformed all the existing proteasomal cleavage prediction methods. References:
|