HELP AND DOCUMENTATION
NAME
This field is necessary. A default name `query' is given in case client
does not wish to give his/her own name to the query.
Paste your sequence
The DNA sequence can be pasted into the text area. In case the Format of
the sequence is any of the standard ones (EMBL, FASTA, GENBANK, etc.) then
`INPUT-FORMAT' should be selected to `FORMATTED' or to `NON-FORMATTED' in
case the input sequence is just nucleotide sequence.
UPLOAD-FILE
File containing nucleotide sequence in any of the standard formats or a
non-formatted DNA sequence can be uploaded using this option. Users can-
-not upload a sequence file and paste the sequence simultaneously to be
analyzed together.
INPUT-FORMAT
The program recognizes any of the standard formats (EMBL, FASTA, GENBANK,
etc.). It uses the ReadSeq program developed by Dr. Don Gilbert, Biology
Dept., Indiana University, to read the input sequence and can accept most
commonly used standard sequence formats. Users should select `FORMATTED'
if the input sequence is in any of these standard formats or `NON-FORMAT-
-TED' if the input sequence is just the nucleotide sequence.
OUTPUT-FORMAT
The server gives the result in either of the two formats-
TABULAR or GRAPHICAL
In TABULAR OUTPUT it gives the values of the Fourier spectra or Power at
different frequencies in case of GENESCAN or m1, m2, m3 in case of ZCurve.
In GRAPHICAL OUTPUT it gives the plot of Power vs frequency in case of
GENESCAN while in case of ZCurve it is a plot of m1 vs m3. In case of FTG
the TABULAR OUTPUT is a table of Power at different frequencies while the
GRAPHICAL OUTPUT gives a spectrum of Power vs frequency.
FROM_&_TO
Users can select a particular region from the input sequence data to anal-
-yze through this property.
Certain tips--
If the user wants to do a complete sequence analysis but does not know
the last base number, he/she can leave the `TO' field empty and give `1'
in the `FROM' field.
If the user wants to do analysis on the region 230-590 for eg. he/she
should give `230' in the `FROM' field and `590' in the `TO' field.
Do not leave `FROM' field empty.
ALGORITHM
Basically there are three different algorithms and their three modificat-
-ions. The Algorithms are -GENESCAN, LENGTHEN-SHUFFLE and FTG while their
modifications are- GENESCAN-WINDOW, LENGTHEN-SHUFFLE-WINDOW and FTG-WINDOW.
The WINDOW options of each of these algorithms are given for convenience.
A long DNA sequence to be analyzed for multiple protein-coding regions can
be analyzed using these options. Once protein coding regions are identified
they can be confirmed for periodicity using the original versions of the
algorithms.
GENESCAN
This algorithm uses a Fourier technique based on a distinctive feature
of protein-coding regions, the 3-base periodicity. The signature of
this (also other) periodicity can be observed most directly through the
Fourier analysis.
A sequence of N nucleotides may be formally viewed as a symbol string,
{xj, j=1,2,.....,N}, where xj is one of the four symbols A, T, G and C,
and denotes the occurrence of that particular nucleotide in position j.
One can define a binary indicator function or projection operator Ua
which selects the elements of the sequence that are equal to the symbol
a, namely Ua(xj)=1 if xj is a and 0 otherwise. Using the operators UA,UT,
UG,UC, successively on a DNA sequence yields four binary sequences, as
illustrated below;
Sequence GGATACACTTTAGAG
Apply UA 001010100001010
Apply UT 000100001110000
Apply UG 110000000000101
Apply UC 000001010000000
Figure 1.
Thus, any DNA sequence can be converted to four binary sequences, which
can then be Fourier analyzed in the normal manner, to examine correlat-
ions between the symbols. The total Fourier spectrum of the DNA sequence
is the sum of these individual spectra, namely;
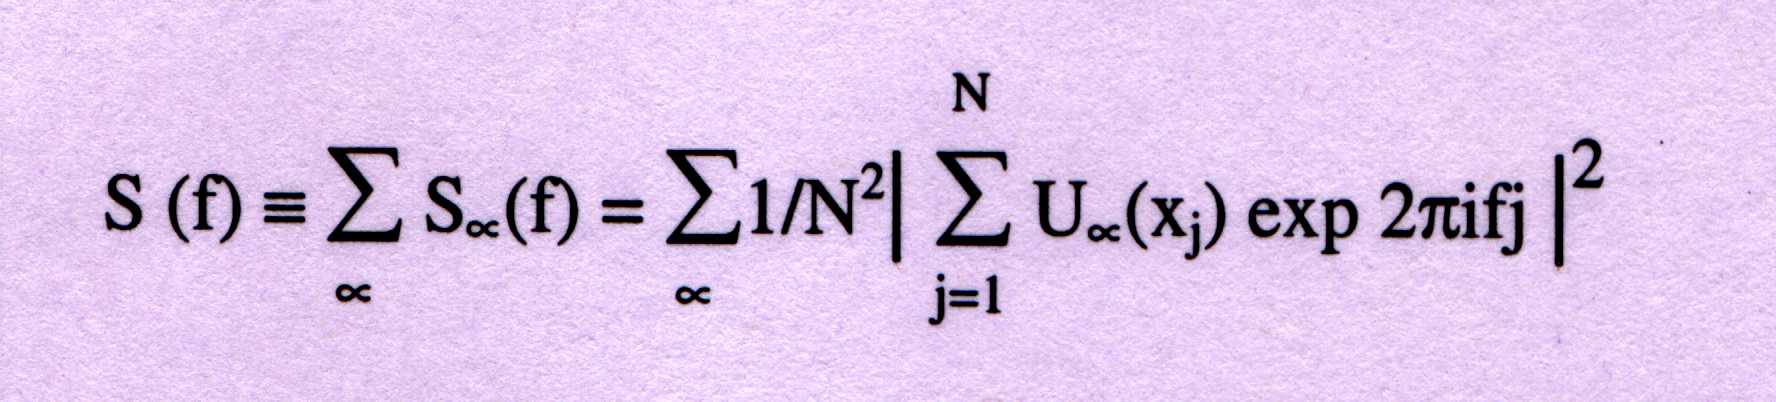 -----------(1)
where the discrete frequency f=k/N, with k=1,2,....N/2. Sa(f) is the par-
-tial spectrum corresponding to the symbol a=A, G, C, or T. The average
of the total spectrum, S^, can be calculated from the frequency of occur-
-rence, þa of each symbol (a=A, T, G, C) as;
-----------(1)
where the discrete frequency f=k/N, with k=1,2,....N/2. Sa(f) is the par-
-tial spectrum corresponding to the symbol a=A, G, C, or T. The average
of the total spectrum, S^, can be calculated from the frequency of occur-
-rence, þa of each symbol (a=A, T, G, C) as;
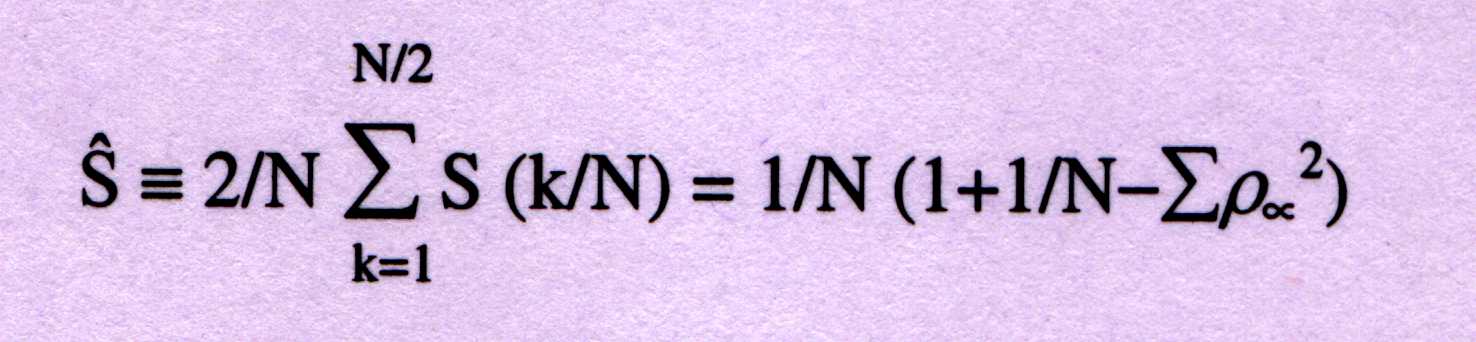 -----------(2)
For protein-coding sequences from a variety of organisms, the Fourier sp-
-ectrum [equation(1)] reveals the characteristic periodicity of three as
a distinct peak at frequency f=1/3. No such `peak' above noise level is
apparent for non-protein coding sequences such as rRNA, intergenic spacers
and introns, which have a flat Fourier spectrum devoid of any periodicity.
In order to contrast signal-to-noise ratio of the peak at f=1/3, is given
as;
-----------(2)
For protein-coding sequences from a variety of organisms, the Fourier sp-
-ectrum [equation(1)] reveals the characteristic periodicity of three as
a distinct peak at frequency f=1/3. No such `peak' above noise level is
apparent for non-protein coding sequences such as rRNA, intergenic spacers
and introns, which have a flat Fourier spectrum devoid of any periodicity.
In order to contrast signal-to-noise ratio of the peak at f=1/3, is given
as;
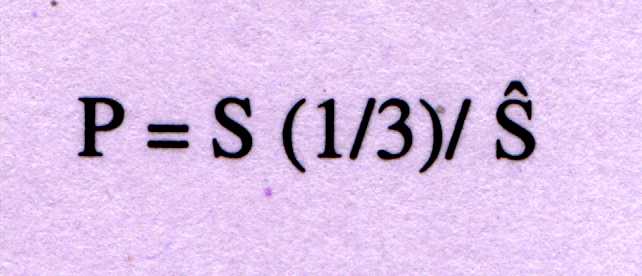 -----------(3)
P=4 is used as discriminator between coding and non-coding sequences.
For a detailed description of the algorithm please refer the original
paper (Tiwari et al., 1997).
The academic version of the program is available for distribution and
can be accessed at http://202.41.10.146/GS.html
LENGTHEN-SHUFFLE
Due to the limited length (usually 100bp or so) of the window used in gene
finding process, the application of the Fourier measure is without imp-
-ressive success. For a longer sequence, >1024bp, it is easier to detect
the periodicity by the FFT algorithm. This algorithm find a way to solve
this problem.
FORMAT OF Z CURVES:
Consider a DNA sequence with N bases read from the 5-end to the 3-end.
Begining from th first base, inspect the sequence one base at a time. Let
the number of steps be denoted by n, i.e. n=1,2,....N. In the nth step,
count the cumulative numbers of the bases A, C, G and T, respectively,
occurring in the subsequence from the first to the nth base in the DNA
sequence inspected. Denote the four positive integers by An, Cn, Gn, and
Tn, respectively. The Zcurve consists of a series of nodes Pn(n=1,2,....N)
whose coordinates are denoted by xn, yn, and zn. It was shown that
xn = 2(An + Gn) - n,
yn = 2(An + Cn) - n, n=0,1,2...........,N -----------(4)
zn = 2(An + Tn) - n,
where A0=C0=G0=T0=0 and thus x0=y0=z0=0. The connection of nodes P0(i.e.
the origin), P1, P2,...PN one by one by lines is defined as the Z curve
of the DNA sequence inspected. We then define;
§xn = xn - xn-1,
§yn = yn - yn-1, n=1,2,....N ------------(5)
§zn = zn - zn-1,
where §xn, §yn and §zn can only have the values of 1 or -1. §xn is equal
to 1 when the nth base is A or G(Purine), or -1 when the nth base is C or
T(Pyrimidine); §yn is equal to 1 when the nth base is A or C(amino-type),
or -1 when the nth base is G or T(keto-type); §zn is equal to 1 when the
nth base is A or T(weak hydrogen bond), or -1 when the nth base is G or C
(strong hydrogen bond). Therefore, DNA sequence can be decomposed into 3
series of digital signals, consisting of 1 or -1, each of which has clear
biological meaning. The first series of digital signals §xn represents
the distribution of the bases of the purine/pyrimidine along the DNA
sequences. The second series §yn represents the distribution of the bases
of the amino/keto types along the sequence. Similarly, the third series
§zn, represents the distribution of the bases of the strong/weak hydrogen
bonds along the sequence.
A LENTHEN-SHUFFLE FOURIER TRANSFORM:
The relatively short DNA sequence D(<150bp) is first lengthened by repeating
the sequence K times, where K=1200/D. Obviously a bogus periodicity of
D will be observed in the power spectrum of the FFT. To eliminate such a
bogus periodicity, and at the same time keep the periodicity of 3 uncha-
-nged, the lengthened sequence is then shuffled M times with three cons-
-ecutive bases as a unit. A typical value of M used here is 10,000.
As mentioned above, based on the the format of the Zcurve, any DNA sequ-
-ence can be transformed into three series of digital signals, §xn, §yn,
and §zn, to which to apply the FFT algorithm. The power spectrum for
each series is calculated as follows:
-----------(3)
P=4 is used as discriminator between coding and non-coding sequences.
For a detailed description of the algorithm please refer the original
paper (Tiwari et al., 1997).
The academic version of the program is available for distribution and
can be accessed at http://202.41.10.146/GS.html
LENGTHEN-SHUFFLE
Due to the limited length (usually 100bp or so) of the window used in gene
finding process, the application of the Fourier measure is without imp-
-ressive success. For a longer sequence, >1024bp, it is easier to detect
the periodicity by the FFT algorithm. This algorithm find a way to solve
this problem.
FORMAT OF Z CURVES:
Consider a DNA sequence with N bases read from the 5-end to the 3-end.
Begining from th first base, inspect the sequence one base at a time. Let
the number of steps be denoted by n, i.e. n=1,2,....N. In the nth step,
count the cumulative numbers of the bases A, C, G and T, respectively,
occurring in the subsequence from the first to the nth base in the DNA
sequence inspected. Denote the four positive integers by An, Cn, Gn, and
Tn, respectively. The Zcurve consists of a series of nodes Pn(n=1,2,....N)
whose coordinates are denoted by xn, yn, and zn. It was shown that
xn = 2(An + Gn) - n,
yn = 2(An + Cn) - n, n=0,1,2...........,N -----------(4)
zn = 2(An + Tn) - n,
where A0=C0=G0=T0=0 and thus x0=y0=z0=0. The connection of nodes P0(i.e.
the origin), P1, P2,...PN one by one by lines is defined as the Z curve
of the DNA sequence inspected. We then define;
§xn = xn - xn-1,
§yn = yn - yn-1, n=1,2,....N ------------(5)
§zn = zn - zn-1,
where §xn, §yn and §zn can only have the values of 1 or -1. §xn is equal
to 1 when the nth base is A or G(Purine), or -1 when the nth base is C or
T(Pyrimidine); §yn is equal to 1 when the nth base is A or C(amino-type),
or -1 when the nth base is G or T(keto-type); §zn is equal to 1 when the
nth base is A or T(weak hydrogen bond), or -1 when the nth base is G or C
(strong hydrogen bond). Therefore, DNA sequence can be decomposed into 3
series of digital signals, consisting of 1 or -1, each of which has clear
biological meaning. The first series of digital signals §xn represents
the distribution of the bases of the purine/pyrimidine along the DNA
sequences. The second series §yn represents the distribution of the bases
of the amino/keto types along the sequence. Similarly, the third series
§zn, represents the distribution of the bases of the strong/weak hydrogen
bonds along the sequence.
A LENTHEN-SHUFFLE FOURIER TRANSFORM:
The relatively short DNA sequence D(<150bp) is first lengthened by repeating
the sequence K times, where K=1200/D. Obviously a bogus periodicity of
D will be observed in the power spectrum of the FFT. To eliminate such a
bogus periodicity, and at the same time keep the periodicity of 3 uncha-
-nged, the lengthened sequence is then shuffled M times with three cons-
-ecutive bases as a unit. A typical value of M used here is 10,000.
As mentioned above, based on the the format of the Zcurve, any DNA sequ-
-ence can be transformed into three series of digital signals, §xn, §yn,
and §zn, to which to apply the FFT algorithm. The power spectrum for
each series is calculated as follows:
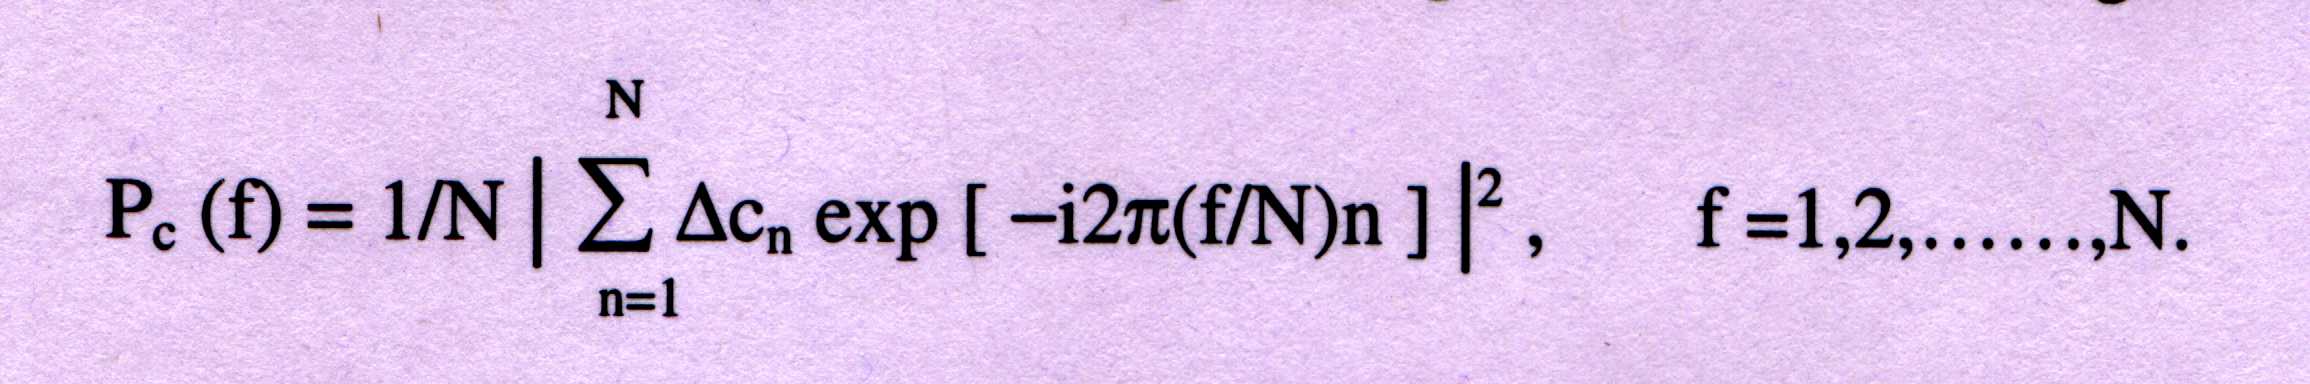 -------------(6)
where PC(f) is the power spectrum associated with §Cn which represents
§xn, §yn and §zn. Now three values are obtained, m1=Px(N/3), m2=Py(N/3) and
m3=Pz(N/3). The Fisher linear discriminant equation is used for making the
coding/non-coding decision.
For a detailed description of the algorithm please refer the original
paper (Yan et al., 1998).
The program is available on request from C.-T. Zhang ctzhang@tju.edu.cn
FTG
FTG algorithm combines the properties of both GENESCAN and LENGTHEN-SHUF-
-FLE algorithms to improve the accuracy of gene prediction. The drawback
of the GENESCAN algorithm is that the spectrum of any short DNA sequence
say <150bp, a window-size generally used, is not clear thereby the peri-
-odicity becomes incoherent. Though the LENGTHEN-SHUFFLE algorithm tries
to address this problem, it has the drawback of not indicating the type
of periodicity that a DNA sequence has. FTG tries to overcome these limi-
-tations by combining the essential parts of the two algorithms- GENESCAN,
and LENGTHEN-SHUFFLE so as to amplify the three-base periodicity of the
DNA sequence.
FTG takes short nucleotide sequences of length D (where D<=1200) and then
amplifies it by repeating it K times (where K=(1200/D)+1). The bogus per-
-iodicity of D is removed by shuffling the sequence M times (where M=10000)
Now the extended DNA sequence is considered as a symbol string, {xj, j=1,2
....,N}, where xj is one of the four symbols A, C, G and T, and denotes
the occurrence of that particular nucleotide in position j. Now defined a
binary indicator function or projection operator Ua which selects the
elements of the sequence that are equal to the symbol a, namely Ua(xj)=1
if xj is a and 0 otherwise. Using the operators UA, UT, UG and UC successively
on a DNA sequence yields four binary sequence, as illustrated in Figure 1.
The four binary sequences obtained can then be Fourier analyzed in the
normal manner. Fourier spectrum of the DNA sequence is calculated using
equation 1, while the average spectrum is calculated by using equation 2.
Peak at f=1/3 is obtained and signal-to-noise ratio of the peak at f=1/3
is obtained using equation 3.
GENESCAN-WINDOW, LENGTHEN-SHUFFLE-WINDOW and FTG-WINDOW
The user can analyze long DNA sequences using these WINDOW option of each
algorithm. User has to specify Step-size and Window length for these three
algorithm. The program takes overlapping Window separated by the Step-size
and analyzes each Window and outputs the values for that Window. The adva-
-tage that this option offers is to analyze the whole input sequence con-
-tinuously window-by-window, saving precious time.
Step-Size_&_Window
Consider a DNA sequence of 10000 bp length. Now I want to analyze the
sequence with overlapping windows of 150 bp which are overlapping each
other. Suppose I want to take window after every 5 bp. Then I would give
a Step-size of 5 and Window of 150 in the submission form.
1--ACGTGCTAGCTGATGCTAGTGC---100--CATCGACTAGCATCAGCTACAGCTACGATCAGCACTGATC----10000
|----------------------|
<-------------Window-length----1st Window--------->
|----------------------|
<-------------2nd Window-------------------------->
|--|
Step-size
|----------------------|
<------------------3rd Window--------------------->
It is useful to remember that results will be much more reliable for a
smaller Step-size.
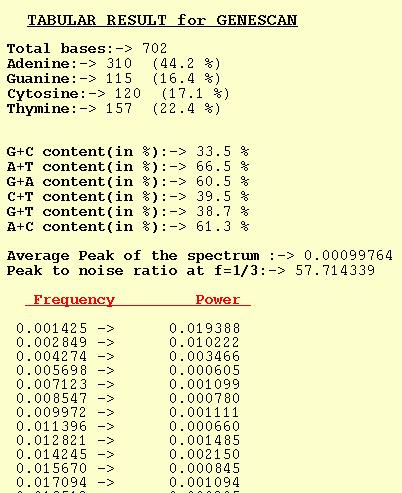
TABULAR_OUTPUT
GENESCAN
The tabular output option for GENESCAN outputs Power for different
frequencies. The average of the Peaks for a spectrum is also output
along with Peak-to-noise ratio at f=1/3. Trivia such as nucleotide
composition and dinucleotide content are also computed by the program.
-------------(6)
where PC(f) is the power spectrum associated with §Cn which represents
§xn, §yn and §zn. Now three values are obtained, m1=Px(N/3), m2=Py(N/3) and
m3=Pz(N/3). The Fisher linear discriminant equation is used for making the
coding/non-coding decision.
For a detailed description of the algorithm please refer the original
paper (Yan et al., 1998).
The program is available on request from C.-T. Zhang ctzhang@tju.edu.cn
FTG
FTG algorithm combines the properties of both GENESCAN and LENGTHEN-SHUF-
-FLE algorithms to improve the accuracy of gene prediction. The drawback
of the GENESCAN algorithm is that the spectrum of any short DNA sequence
say <150bp, a window-size generally used, is not clear thereby the peri-
-odicity becomes incoherent. Though the LENGTHEN-SHUFFLE algorithm tries
to address this problem, it has the drawback of not indicating the type
of periodicity that a DNA sequence has. FTG tries to overcome these limi-
-tations by combining the essential parts of the two algorithms- GENESCAN,
and LENGTHEN-SHUFFLE so as to amplify the three-base periodicity of the
DNA sequence.
FTG takes short nucleotide sequences of length D (where D<=1200) and then
amplifies it by repeating it K times (where K=(1200/D)+1). The bogus per-
-iodicity of D is removed by shuffling the sequence M times (where M=10000)
Now the extended DNA sequence is considered as a symbol string, {xj, j=1,2
....,N}, where xj is one of the four symbols A, C, G and T, and denotes
the occurrence of that particular nucleotide in position j. Now defined a
binary indicator function or projection operator Ua which selects the
elements of the sequence that are equal to the symbol a, namely Ua(xj)=1
if xj is a and 0 otherwise. Using the operators UA, UT, UG and UC successively
on a DNA sequence yields four binary sequence, as illustrated in Figure 1.
The four binary sequences obtained can then be Fourier analyzed in the
normal manner. Fourier spectrum of the DNA sequence is calculated using
equation 1, while the average spectrum is calculated by using equation 2.
Peak at f=1/3 is obtained and signal-to-noise ratio of the peak at f=1/3
is obtained using equation 3.
GENESCAN-WINDOW, LENGTHEN-SHUFFLE-WINDOW and FTG-WINDOW
The user can analyze long DNA sequences using these WINDOW option of each
algorithm. User has to specify Step-size and Window length for these three
algorithm. The program takes overlapping Window separated by the Step-size
and analyzes each Window and outputs the values for that Window. The adva-
-tage that this option offers is to analyze the whole input sequence con-
-tinuously window-by-window, saving precious time.
Step-Size_&_Window
Consider a DNA sequence of 10000 bp length. Now I want to analyze the
sequence with overlapping windows of 150 bp which are overlapping each
other. Suppose I want to take window after every 5 bp. Then I would give
a Step-size of 5 and Window of 150 in the submission form.
1--ACGTGCTAGCTGATGCTAGTGC---100--CATCGACTAGCATCAGCTACAGCTACGATCAGCACTGATC----10000
|----------------------|
<-------------Window-length----1st Window--------->
|----------------------|
<-------------2nd Window-------------------------->
|--|
Step-size
|----------------------|
<------------------3rd Window--------------------->
It is useful to remember that results will be much more reliable for a
smaller Step-size.
TABULAR_OUTPUT
GENESCAN
The tabular output option for GENESCAN outputs Power for different
frequencies. The average of the Peaks for a spectrum is also output
along with Peak-to-noise ratio at f=1/3. Trivia such as nucleotide
composition and dinucleotide content are also computed by the program.
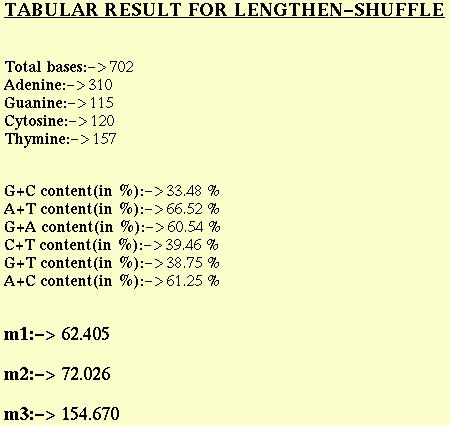
 LENGTHEN-SHUFFLE
The LENGTHEN-SHUFFLE algorithm outputs m1, m2, m3 as table along with
the sequence composition analysis report.
LENGTHEN-SHUFFLE
The LENGTHEN-SHUFFLE algorithm outputs m1, m2, m3 as table along with
the sequence composition analysis report.
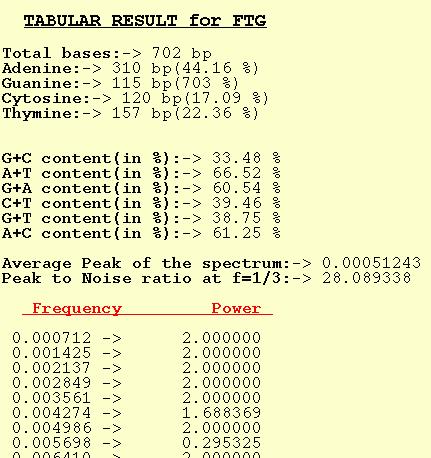
 FTG
The tabular output option for FTG outputs Peaks at different freque-
-ncies. The average of the Peaks for a spectrum is also output along
with Peak-to-noise ratio at f=1/3. Nucleotide composition and dinuc-
-leotide content are also computed by the program.
FTG
The tabular output option for FTG outputs Peaks at different freque-
-ncies. The average of the Peaks for a spectrum is also output along
with Peak-to-noise ratio at f=1/3. Nucleotide composition and dinuc-
-leotide content are also computed by the program.
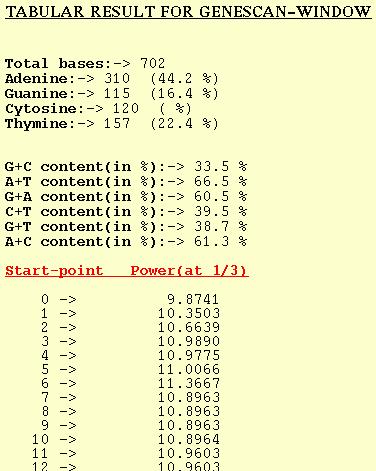
 GENESCAN-WINDOW
For each window analyzed the GENESCAN-WINDOW option outputs the Peak
or Power at f=1/3. The start-point in the table refers to the position
of first base of the window. Normal sequence analysis of the DNA seq-
-uence is also given.
GENESCAN-WINDOW
For each window analyzed the GENESCAN-WINDOW option outputs the Peak
or Power at f=1/3. The start-point in the table refers to the position
of first base of the window. Normal sequence analysis of the DNA seq-
-uence is also given.
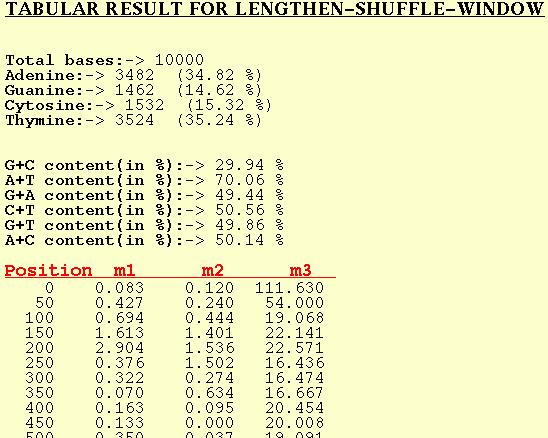
 LENGTHEN-SHUFFLE-WINDOW
For each window of the DNA sequence m1, m2, and m3 are computed and
output by the program for this option. Position in this table refers
to the first base position of the window in the input DNA sequence.
LENGTHEN-SHUFFLE-WINDOW
For each window of the DNA sequence m1, m2, and m3 are computed and
output by the program for this option. Position in this table refers
to the first base position of the window in the input DNA sequence.
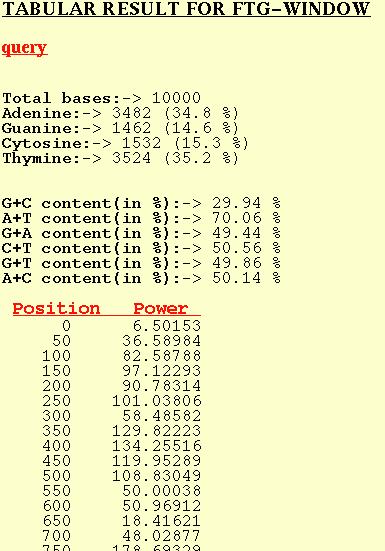
 FTG-WINDOW
The position in the table refers to the first base of the window and
the corresponding Power refers to the Peak at f=1/3 for that window.
Normal nucleotide compositional analysis is also given.
FTG-WINDOW
The position in the table refers to the first base of the window and
the corresponding Power refers to the Peak at f=1/3 for that window.
Normal nucleotide compositional analysis is also given.
 GRAPHICAL_OUTPUT
GENESCAN
A plot of Power[S(f)] vs frequency(f) is output with this option.
The periodicity of three can be visible as a peak at f=0.33(1/3).
Average peak of the spectrum and Peak at f=1/3 is given.
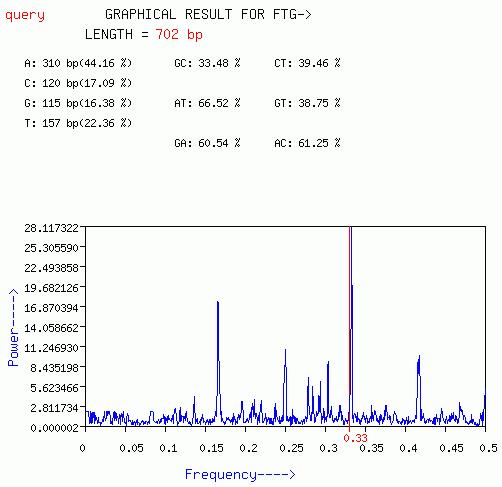
GRAPHICAL_OUTPUT
GENESCAN
A plot of Power[S(f)] vs frequency(f) is output with this option.
The periodicity of three can be visible as a peak at f=0.33(1/3).
Average peak of the spectrum and Peak at f=1/3 is given.
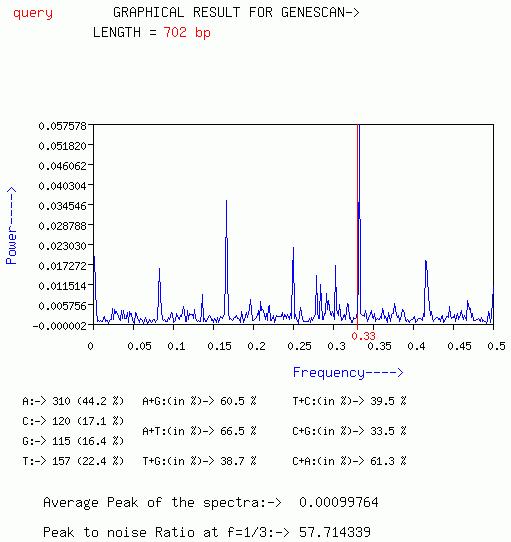 A periodicity of 10 can be visible as a peak at f=0.10(1/10). Similarly
other periodicity can be observed with this plot.
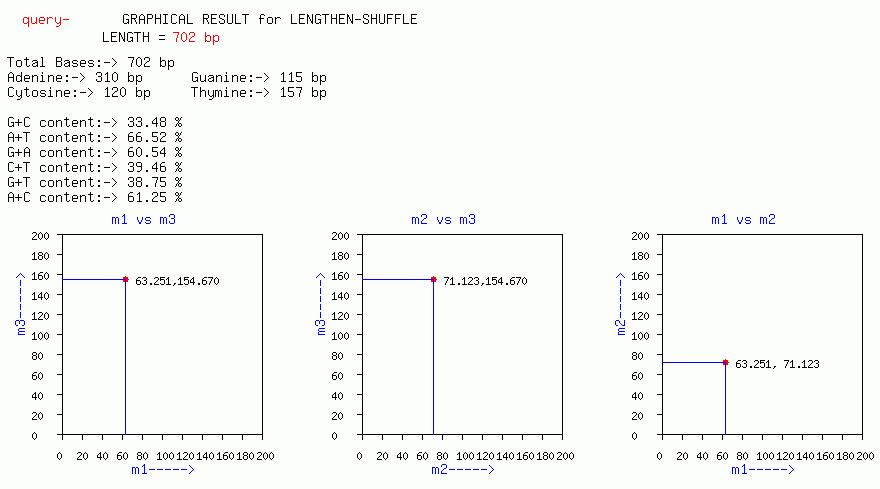
LENGTHEN-SHUFFLE
Plots of m3 vs m1, m3 vs m2, m2 vs m1, are output with this option.
A periodicity of 10 can be visible as a peak at f=0.10(1/10). Similarly
other periodicity can be observed with this plot.
LENGTHEN-SHUFFLE
Plots of m3 vs m1, m3 vs m2, m2 vs m1, are output with this option.
 FTG
This plot is quiet similar to the plot obtained from GENESCAN option
except that FTG option works best for short nucleotide sequences.
FTG
This plot is quiet similar to the plot obtained from GENESCAN option
except that FTG option works best for short nucleotide sequences.
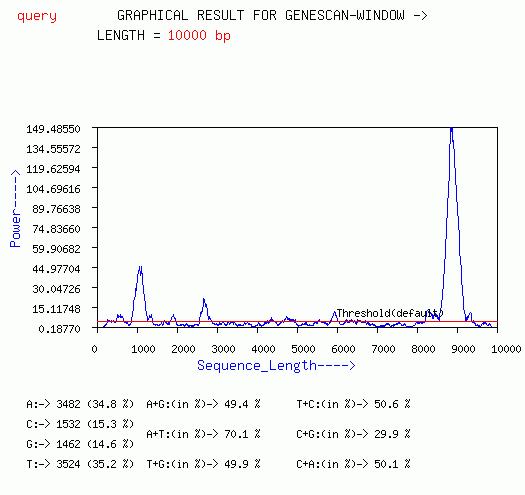
 GENESCAN-WINDOW
The Window version of the GENESCAN algorithm gives a plot of Peak at
f=1/3 for each window vs sequence length. The red horizontal line is
the default threshold for the coding/non-coding decision. If the line
of the spectrum goes above this threshold then the region is considered
coding.
GENESCAN-WINDOW
The Window version of the GENESCAN algorithm gives a plot of Peak at
f=1/3 for each window vs sequence length. The red horizontal line is
the default threshold for the coding/non-coding decision. If the line
of the spectrum goes above this threshold then the region is considered
coding.
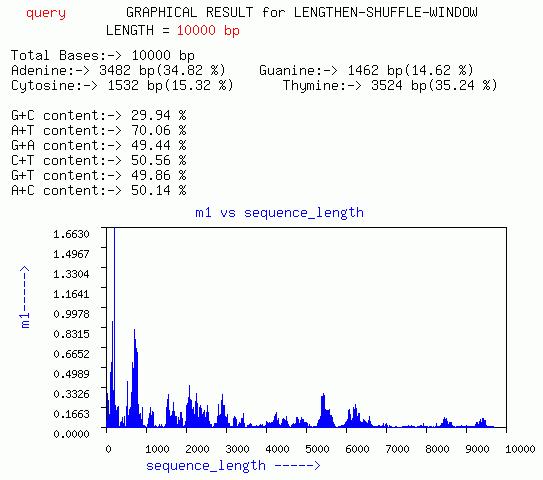
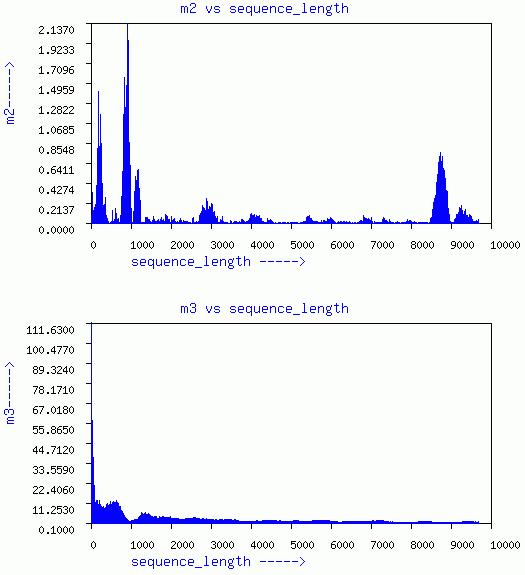
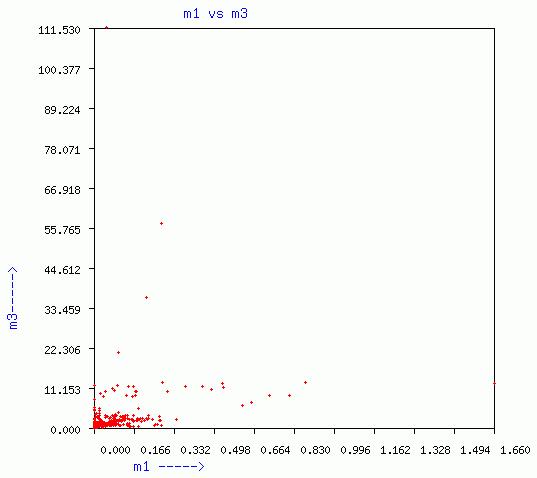
 LENGTHEN-SHUFFLE-WINDOW
Three graphs of sequence length vs m1, m2, and m3, respectively are
given. In addition a plot of m3 vs m1 for different window is given.
LENGTHEN-SHUFFLE-WINDOW
Three graphs of sequence length vs m1, m2, and m3, respectively are
given. In addition a plot of m3 vs m1 for different window is given.
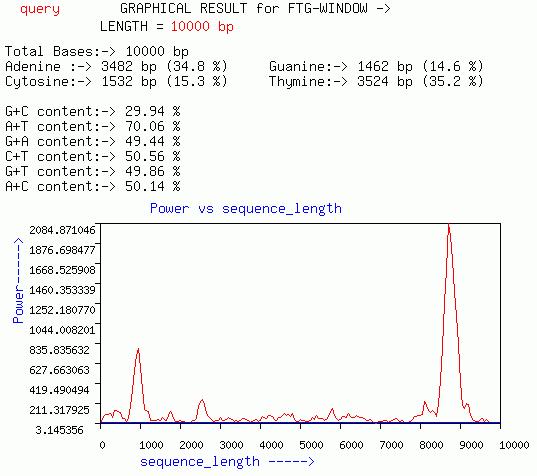
 FTG-WINDOW
This graph is quiet similar to that of GENESCAN-WINDOW graph except
it gives a plot of Power at f=1/3 for overlapping windows of size less
less than 1200 (ideally less than 150).
FTG-WINDOW
This graph is quiet similar to that of GENESCAN-WINDOW graph except
it gives a plot of Power at f=1/3 for overlapping windows of size less
less than 1200 (ideally less than 150).