Algorithm
Dataset
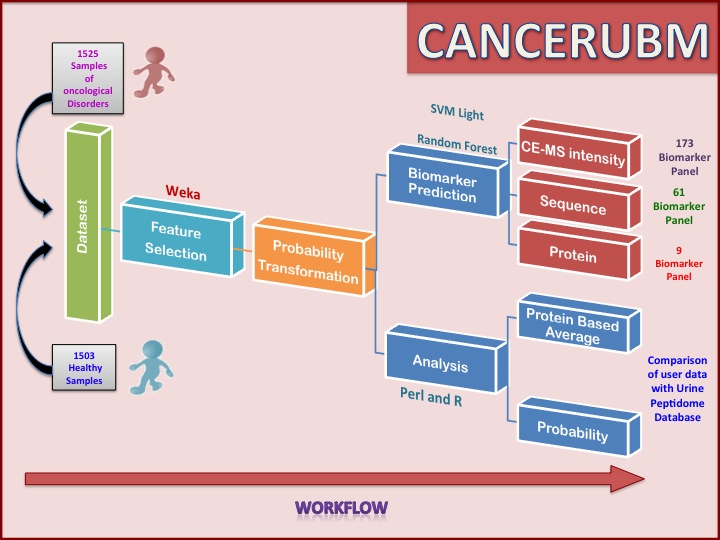
This includes 1525 cancerous samples as positive training data, 1503 negative samples from Urine Peptidome Database.This data was used for analysis.For each sample there are 5605 peptides(Features) characterized by Mass in Daltons and C.E time in minutes.For every peptide, each number represents the calibrated amplitude of the mass spectrometric signal of each peptide/protein detected in the sample.
Feature Selection
Feature selection is applied on the dataset of 5605 features. The cfsSubsetEval method from weka is used for feature selection is used with parameters Best it –D1 –N%. In this method subsets of features that are highly correlated with the class and has low inter-correlation is preferred. This method resulted in 173 features, which are used for further downstream log probability transformations and probability transformation and further classifier models are develop using svm Light.
Log and Probability Analysis
As the range of data is very high the log transformation of data is done to improve the interpretability of the data. After log transformation each data value was transformed into probability values. To convert into probability values, the range of intensity signal was divided into ten bins and probability of each bin is calculated. Each log-transformed value is replaced by the probability value of the bin to which it belonged.
Protein Level Analysis
Out of 173 peptides, sequence and protein information is known for 61 peptides from the urinary peptidome database. These 61 peptides map to 15 proteins. Nine proteins are such which have more than two or more than two peptides in the dataset. To get the proteomic view mean, mode and max of each set of peptides belonging to particular protein is calculated, then the svm models are developed on the basis of mean, median and max of the each set of peptides for particular protein.
Evaluation of Performance
Five-fold cross validation technique has been used. Four sets are used for training and remaining one in used for testing, in this way the process repeats five times. Evaluation of performance of different SVM modules has been done by calculating accuracy and Matthew's correlation coefficient (MCC).