Algorithms used in AHTpin | ||||||
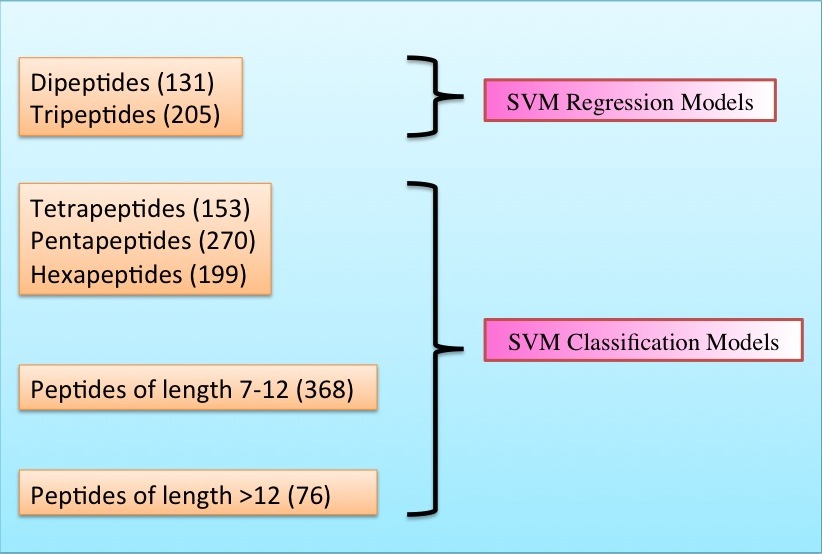
Datasets-The peptides were derived mainly from AHTPDB, BIOPEP and ACEpepDB databases. We have developed models on separate datasets made according to the length of the peptide as in the figure below.
| 
| Descriptors Used[1] Amino Acid Composition : It is the percentage content of each amino acid in a peptide/protein and is represented by a vector of 20 values for 20 natural amino acids calculated by the formulaComposition of amino acid (i) = Frequency of amino acid (i) / Length of the protein where i can be any natural amino acid [3] Chemical Descriptors : A total of 15,537 types of descriptors, including 1D, 2D, 3D and 10 different types of binary fingerprints were calculated using the PaDEL software and only the minimum number of important descriptors were used for model building.
| Machine Learning TechniqueSupport vector machines (SVMs) were trained with the selected sequence and atomic features. SVM allows choosing a number of parameters and kernels. The SVMlight software package (available at http://svmlight.joachims.org/) was used to construct SVM classifiers and regression models. In this study, we used the radial basis function (RBF) kernel:.k(x ,y)=exp(-γ||x - y||2) where x and y are two data vectors, and γ is a training parameter.
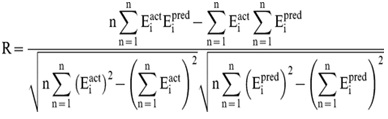
| Evaluation of Regression models In order to evaluate performance of our models, we used Pearson’s correlation coefficient (R). All models were evaluated using five-fold cross validation technique.
Where n is the size of test set, Eipred and Eiact is the predicted and actual IC50 values respectively.
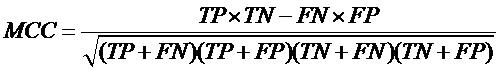
| Evaluation of Classification models In order to evaluate performance of our models, we used Mathew’s correlation coefficient (MCC). All models were evaluated using five-fold cross validation technique.
where TP, FP, TN and FN stand for True Positives, False Positive, True negative and False Negative respectively. |